5G Network Slicing Market Size, Growth, Trends | Report 2023-2032
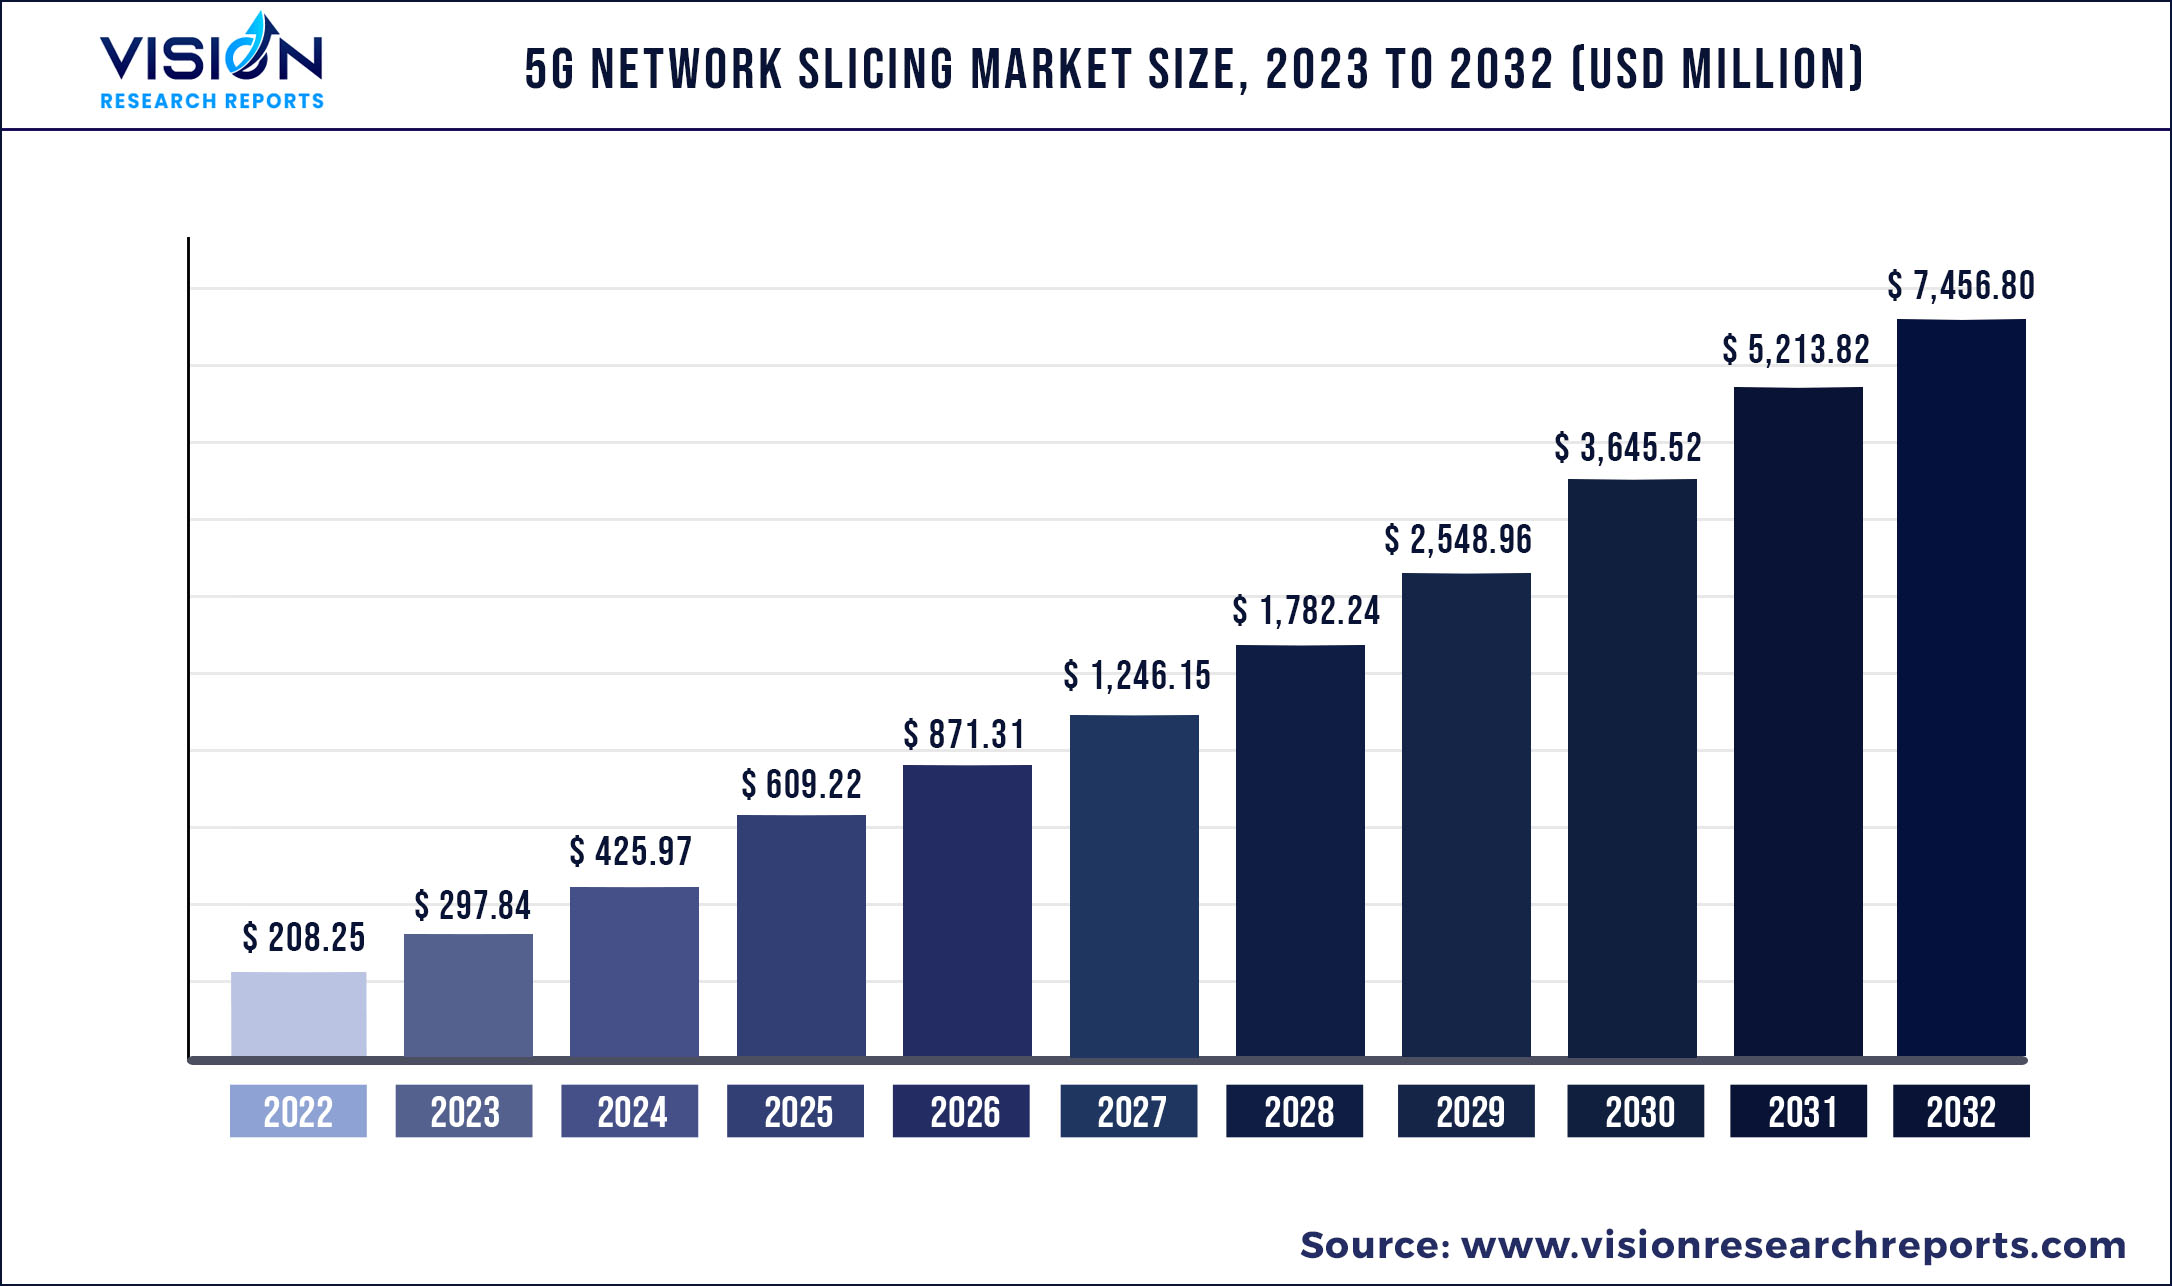
The global 5G network slicing market was valued at USD 208.25 million in 2022 and it is predicted to surpass around USD 7,456.80 million by 2032 with a CAGR of 43.02% from 2023 to 2032.
Key Pointers
Report Scope of the 5G Network Slicing Market
| Report Coverage | Details |
| Market Size in 2022 | USD 208.25 million |
| Revenue Forecast by 2032 | USD 7,456.80 million |
| Growth rate from 2023 to 2032 | CAGR of 43.02% |
| Base Year | 2022 |
| Forecast Period | 2023 to 2032 |
| Market Analysis (Terms Used) | Value (US$ Million/Billion) or (Volume/Units) |
| Regions Covered | North America, Europe, Asia Pacific, Latin America, Middle East & Africa |
| Companies Covered | AT&T, Inc.; Telefonaktiebolaget LM Ericsson; Nokia Corporation; Huawei Technologies Co., Ltd.; Cisco Systems, Inc.; Deutsche Telekom AG; Amdocs, Inc.; Vodafone Group plc; ZTE Corporation |
5G network slicing is a technology that allows mobile network operators to create multiple virtual networks within a single physical 5G network infrastructure. 5G network slicing provides several benefits such as increased network flexibility, better resource utilization, improved network efficiency, and enhanced user experiences. It enables mobile network operators to support a wide range of use cases and industries with different performance requirements, while also allowing them to differentiate their services and create new revenue streams. The demand for 5G network slicing is driven by the need for customized and flexible 5G networks that can meet the diverse requirements of various industries and use cases.
The growing adoption of the Internet of Things (IoT) to enable communication between sensors and connected devices is anticipated to increase the demand for 5G network slicing. By creating dedicated network slices for IoT devices, service providers can ensure that these devices have the necessary resources and QoS to operate efficiently and effectively.
Moreover, as the number of IoT devices continues to grow, service providers will need to scale their networks accordingly. 5G network slicing allows them to do so flexibly and cost-effectively creating new network slices as needed and allocating resources as required. This can help service providers to keep pace with the rapidly evolving IoT market and remain competitive. The growing demand for IoT devices and applications is driving the need for 5G network slicing, and this is expected to fuel the growth of the 5G network slicing market in the coming years.
Artificial Intelligence (AI) and Machine Learning (ML) are playing an important role in 5G network slicing. By analyzing network data in real-time, AI and ML algorithms can help to optimize network resource allocation, improve network efficiency, and enhance network security. Moreover, the growing demand for Augmented Reality (AR) and Virtual Reality (VR) in gaming applications is anticipated to increase the demand for 5G network slicing owing to the ability of the network slicing technology to provide a specialized and dedicated logical network.
Several players are collaborating to develop 5G network slicing for AR/VR applications, thereby supporting market growth. For instance, in June 2021, Telefonaktiebolaget LM Ericsson, Samsung Electronics Co. Ltd., and Deutsche Telekom AG announced the world’s first implementation of 5G end-to-end network slicing for cloud VR streaming game application.
Network slicing is a rapidly evolving technology that enables service providers to offer customized connectivity services to their customers based on their specific needs. However, the lack of standardization for 5G standalone network slicing is a challenge that can limit interoperability between different vendors' products and hinder the market’s growth. Moreover, delivering high-quality services to each slice can be challenging, especially when the network is congested or the number of devices in a particular slice increases. Thus, the complexity of designing the 5G network slices is also expected to pose a challenge to market growth.
5G Network Slicing Market Segmentations:
By Component
By Type
By Network Architecture
By Vertical
Chapter 1. Introduction
1.1. Research Objective
1.2. Scope of the Study
1.3. Definition
Chapter 2. Research Methodology
2.1. Research Approach
2.2. Data Sources
2.3. Assumptions & Limitations
Chapter 3. Executive Summary
3.1. Market Snapshot
Chapter 4. Market Variables and Scope
4.1. Introduction
4.2. Market Classification and Scope
4.3. Industry Value Chain Analysis
4.3.1. Raw Material Procurement Analysis
4.3.2. Sales and Distribution Channel Analysis
4.3.3. Downstream Buyer Analysis
Chapter 5. COVID 19 Impact on 5G Network Slicing Market
5.1. COVID-19 Landscape: 5G Network Slicing Industry Impact
5.2. COVID 19 - Impact Assessment for the Industry
5.3. COVID 19 Impact: Global Major Government Policy
5.4. Market Trends and Opportunities in the COVID-19 Landscape
Chapter 6. Market Dynamics Analysis and Trends
6.1. Market Dynamics
6.1.1. Market Drivers
6.1.2. Market Restraints
6.1.3. Market Opportunities
6.2. Porter’s Five Forces Analysis
6.2.1. Bargaining power of suppliers
6.2.2. Bargaining power of buyers
6.2.3. Threat of substitute
6.2.4. Threat of new entrants
6.2.5. Degree of competition
Chapter 7. Competitive Landscape
7.1.1. Company Market Share/Positioning Analysis
7.1.2. Key Strategies Adopted by Players
7.1.3. Vendor Landscape
7.1.3.1. List of Suppliers
7.1.3.2. List of Buyers
Chapter 8. Global 5G Network Slicing Market, By Component
8.1. 5G Network Slicing Market, by Component, 2023-2032
8.1.1. Solutions
8.1.1.1. Market Revenue and Forecast (2020-2032)
8.1.2. Services
8.1.2.1. Market Revenue and Forecast (2020-2032)
Chapter 9. Global 5G Network Slicing Market, By Type
9.1. 5G Network Slicing Market, by Type, 2023-2032
9.1.1. RAN Slicing
9.1.1.1. Market Revenue and Forecast (2020-2032)
9.1.2. Edge Slicing
9.1.2.1. Market Revenue and Forecast (2020-2032)
9.1.3. End-to-End Network Slicing
9.1.3.1. Market Revenue and Forecast (2020-2032)
Chapter 10. Global 5G Network Slicing Market, By Network Architecture
10.1. 5G Network Slicing Market, by Network Architecture, 2023-2032
10.1.1. Standalone
10.1.1.1. Market Revenue and Forecast (2020-2032)
10.1.2. Non-standalone
10.1.2.1. Market Revenue and Forecast (2020-2032)
Chapter 11. Global 5G Network Slicing Market, By Vertical
11.1. 5G Network Slicing Market, by Vertical, 2023-2032
11.1.1. Manufacturing
11.1.1.1. Market Revenue and Forecast (2020-2032)
11.1.2. Healthcare
11.1.2.1. Market Revenue and Forecast (2020-2032)
11.1.3. Smart Cities
11.1.3.1. Market Revenue and Forecast (2020-2032)
11.1.4. Transportation & Logistics
11.1.4.1. Market Revenue and Forecast (2020-2032)
11.1.5. Energy & Utilities
11.1.5.1. Market Revenue and Forecast (2020-2032)
11.1.6. Media & Entertainment
11.1.6.1. Market Revenue and Forecast (2020-2032)
11.1.7. Retail
11.1.7.1. Market Revenue and Forecast (2020-2032)
11.1.8. Others (Financial Services, Public Safety, IT & Telecom, Others)
11.1.8.1. Market Revenue and Forecast (2020-2032)
Chapter 12. Global 5G Network Slicing Market, Regional Estimates and Trend Forecast
12.1. North America
12.1.1. Market Revenue and Forecast, by Component (2020-2032)
12.1.2. Market Revenue and Forecast, by Type (2020-2032)
12.1.3. Market Revenue and Forecast, by Network Architecture (2020-2032)
12.1.4. Market Revenue and Forecast, by Vertical (2020-2032)
12.1.5. U.S.
12.1.5.1. Market Revenue and Forecast, by Component (2020-2032)
12.1.5.2. Market Revenue and Forecast, by Type (2020-2032)
12.1.5.3. Market Revenue and Forecast, by Network Architecture (2020-2032)
12.1.5.4. Market Revenue and Forecast, by Vertical (2020-2032)
12.1.6. Rest of North America
12.1.6.1. Market Revenue and Forecast, by Component (2020-2032)
12.1.6.2. Market Revenue and Forecast, by Type (2020-2032)
12.1.6.3. Market Revenue and Forecast, by Network Architecture (2020-2032)
12.1.6.4. Market Revenue and Forecast, by Vertical (2020-2032)
12.2. Europe
12.2.1. Market Revenue and Forecast, by Component (2020-2032)
12.2.2. Market Revenue and Forecast, by Type (2020-2032)
12.2.3. Market Revenue and Forecast, by Network Architecture (2020-2032)
12.2.4. Market Revenue and Forecast, by Vertical (2020-2032)
12.2.5. UK
12.2.5.1. Market Revenue and Forecast, by Component (2020-2032)
12.2.5.2. Market Revenue and Forecast, by Type (2020-2032)
12.2.5.3. Market Revenue and Forecast, by Network Architecture (2020-2032)
12.2.5.4. Market Revenue and Forecast, by Vertical (2020-2032)
12.2.6. Germany
12.2.6.1. Market Revenue and Forecast, by Component (2020-2032)
12.2.6.2. Market Revenue and Forecast, by Type (2020-2032)
12.2.6.3. Market Revenue and Forecast, by Network Architecture (2020-2032)
12.2.6.4. Market Revenue and Forecast, by Vertical (2020-2032)
12.2.7. France
12.2.7.1. Market Revenue and Forecast, by Component (2020-2032)
12.2.7.2. Market Revenue and Forecast, by Type (2020-2032)
12.2.7.3. Market Revenue and Forecast, by Network Architecture (2020-2032)
12.2.7.4. Market Revenue and Forecast, by Vertical (2020-2032)
12.2.8. Rest of Europe
12.2.8.1. Market Revenue and Forecast, by Component (2020-2032)
12.2.8.2. Market Revenue and Forecast, by Type (2020-2032)
12.2.8.3. Market Revenue and Forecast, by Network Architecture (2020-2032)
12.2.8.4. Market Revenue and Forecast, by Vertical (2020-2032)
12.3. APAC
12.3.1. Market Revenue and Forecast, by Component (2020-2032)
12.3.2. Market Revenue and Forecast, by Type (2020-2032)
12.3.3. Market Revenue and Forecast, by Network Architecture (2020-2032)
12.3.4. Market Revenue and Forecast, by Vertical (2020-2032)
12.3.5. India
12.3.5.1. Market Revenue and Forecast, by Component (2020-2032)
12.3.5.2. Market Revenue and Forecast, by Type (2020-2032)
12.3.5.3. Market Revenue and Forecast, by Network Architecture (2020-2032)
12.3.5.4. Market Revenue and Forecast, by Vertical (2020-2032)
12.3.6. China
12.3.6.1. Market Revenue and Forecast, by Component (2020-2032)
12.3.6.2. Market Revenue and Forecast, by Type (2020-2032)
12.3.6.3. Market Revenue and Forecast, by Network Architecture (2020-2032)
12.3.6.4. Market Revenue and Forecast, by Vertical (2020-2032)
12.3.7. Japan
12.3.7.1. Market Revenue and Forecast, by Component (2020-2032)
12.3.7.2. Market Revenue and Forecast, by Type (2020-2032)
12.3.7.3. Market Revenue and Forecast, by Network Architecture (2020-2032)
12.3.7.4. Market Revenue and Forecast, by Vertical (2020-2032)
12.3.8. Rest of APAC
12.3.8.1. Market Revenue and Forecast, by Component (2020-2032)
12.3.8.2. Market Revenue and Forecast, by Type (2020-2032)
12.3.8.3. Market Revenue and Forecast, by Network Architecture (2020-2032)
12.3.8.4. Market Revenue and Forecast, by Vertical (2020-2032)
12.4. MEA
12.4.1. Market Revenue and Forecast, by Component (2020-2032)
12.4.2. Market Revenue and Forecast, by Type (2020-2032)
12.4.3. Market Revenue and Forecast, by Network Architecture (2020-2032)
12.4.4. Market Revenue and Forecast, by Vertical (2020-2032)
12.4.5. GCC
12.4.5.1. Market Revenue and Forecast, by Component (2020-2032)
12.4.5.2. Market Revenue and Forecast, by Type (2020-2032)
12.4.5.3. Market Revenue and Forecast, by Network Architecture (2020-2032)
12.4.5.4. Market Revenue and Forecast, by Vertical (2020-2032)
12.4.6. North Africa
12.4.6.1. Market Revenue and Forecast, by Component (2020-2032)
12.4.6.2. Market Revenue and Forecast, by Type (2020-2032)
12.4.6.3. Market Revenue and Forecast, by Network Architecture (2020-2032)
12.4.6.4. Market Revenue and Forecast, by Vertical (2020-2032)
12.4.7. South Africa
12.4.7.1. Market Revenue and Forecast, by Component (2020-2032)
12.4.7.2. Market Revenue and Forecast, by Type (2020-2032)
12.4.7.3. Market Revenue and Forecast, by Network Architecture (2020-2032)
12.4.7.4. Market Revenue and Forecast, by Vertical (2020-2032)
12.4.8. Rest of MEA
12.4.8.1. Market Revenue and Forecast, by Component (2020-2032)
12.4.8.2. Market Revenue and Forecast, by Type (2020-2032)
12.4.8.3. Market Revenue and Forecast, by Network Architecture (2020-2032)
12.4.8.4. Market Revenue and Forecast, by Vertical (2020-2032)
12.5. Latin America
12.5.1. Market Revenue and Forecast, by Component (2020-2032)
12.5.2. Market Revenue and Forecast, by Type (2020-2032)
12.5.3. Market Revenue and Forecast, by Network Architecture (2020-2032)
12.5.4. Market Revenue and Forecast, by Vertical (2020-2032)
12.5.5. Brazil
12.5.5.1. Market Revenue and Forecast, by Component (2020-2032)
12.5.5.2. Market Revenue and Forecast, by Type (2020-2032)
12.5.5.3. Market Revenue and Forecast, by Network Architecture (2020-2032)
12.5.5.4. Market Revenue and Forecast, by Vertical (2020-2032)
12.5.6. Rest of LATAM
12.5.6.1. Market Revenue and Forecast, by Component (2020-2032)
12.5.6.2. Market Revenue and Forecast, by Type (2020-2032)
12.5.6.3. Market Revenue and Forecast, by Network Architecture (2020-2032)
12.5.6.4. Market Revenue and Forecast, by Vertical (2020-2032)
Chapter 13. Company Profiles
13.1. AT&T, Inc.
13.1.1. Company Overview
13.1.2. Product Offerings
13.1.3. Financial Performance
13.1.4. Recent Initiatives
13.2. Telefonaktiebolaget LM Ericsson
13.2.1. Company Overview
13.2.2. Product Offerings
13.2.3. Financial Performance
13.2.4. Recent Initiatives
13.3. Nokia Corporation
13.3.1. Company Overview
13.3.2. Product Offerings
13.3.3. Financial Performance
13.3.4. Recent Initiatives
13.4. Huawei Technologies Co., Ltd.
13.4.1. Company Overview
13.4.2. Product Offerings
13.4.3. Financial Performance
13.4.4. Recent Initiatives
13.5. Cisco Systems, Inc.
13.5.1. Company Overview
13.5.2. Product Offerings
13.5.3. Financial Performance
13.5.4. Recent Initiatives
13.6. Deutsche Telekom AG
13.6.1. Company Overview
13.6.2. Product Offerings
13.6.3. Financial Performance
13.6.4. Recent Initiatives
13.7. Amdocs, Inc.
13.7.1. Company Overview
13.7.2. Product Offerings
13.7.3. Financial Performance
13.7.4. Recent Initiatives
13.8. Vodafone Group plc
13.8.1. Company Overview
13.8.2. Product Offerings
13.8.3. Financial Performance
13.8.4. Recent Initiatives
13.9. ZTE Corporation
13.9.1. Company Overview
13.9.2. Product Offerings
13.9.3. Financial Performance
13.9.4. Recent Initiatives
Chapter 14. Research Methodology
14.1. Primary Research
14.2. Secondary Research
14.3. Assumptions
Chapter 15. Appendix
15.1. About Us
15.2. Glossary of Terms
 Cross-segment Market Size and Analysis for
Mentioned Segments
Additional Company Profiles (Upto 5 With No Cost)
Additional Countries (Apart From Mentioned Countries)
Country/Region-specific Report
Go To Market Strategy
Region Specific Market DynamicsRegion Level Market Share Import Export AnalysisProduction AnalysisOthers
Cross-segment Market Size and Analysis for
Mentioned Segments
Additional Company Profiles (Upto 5 With No Cost)
Additional Countries (Apart From Mentioned Countries)
Country/Region-specific Report
Go To Market Strategy
Region Specific Market DynamicsRegion Level Market Share Import Export AnalysisProduction AnalysisOthers