5G Optical Transceiver Market Size, Growth, Trends | Report 2023-2032
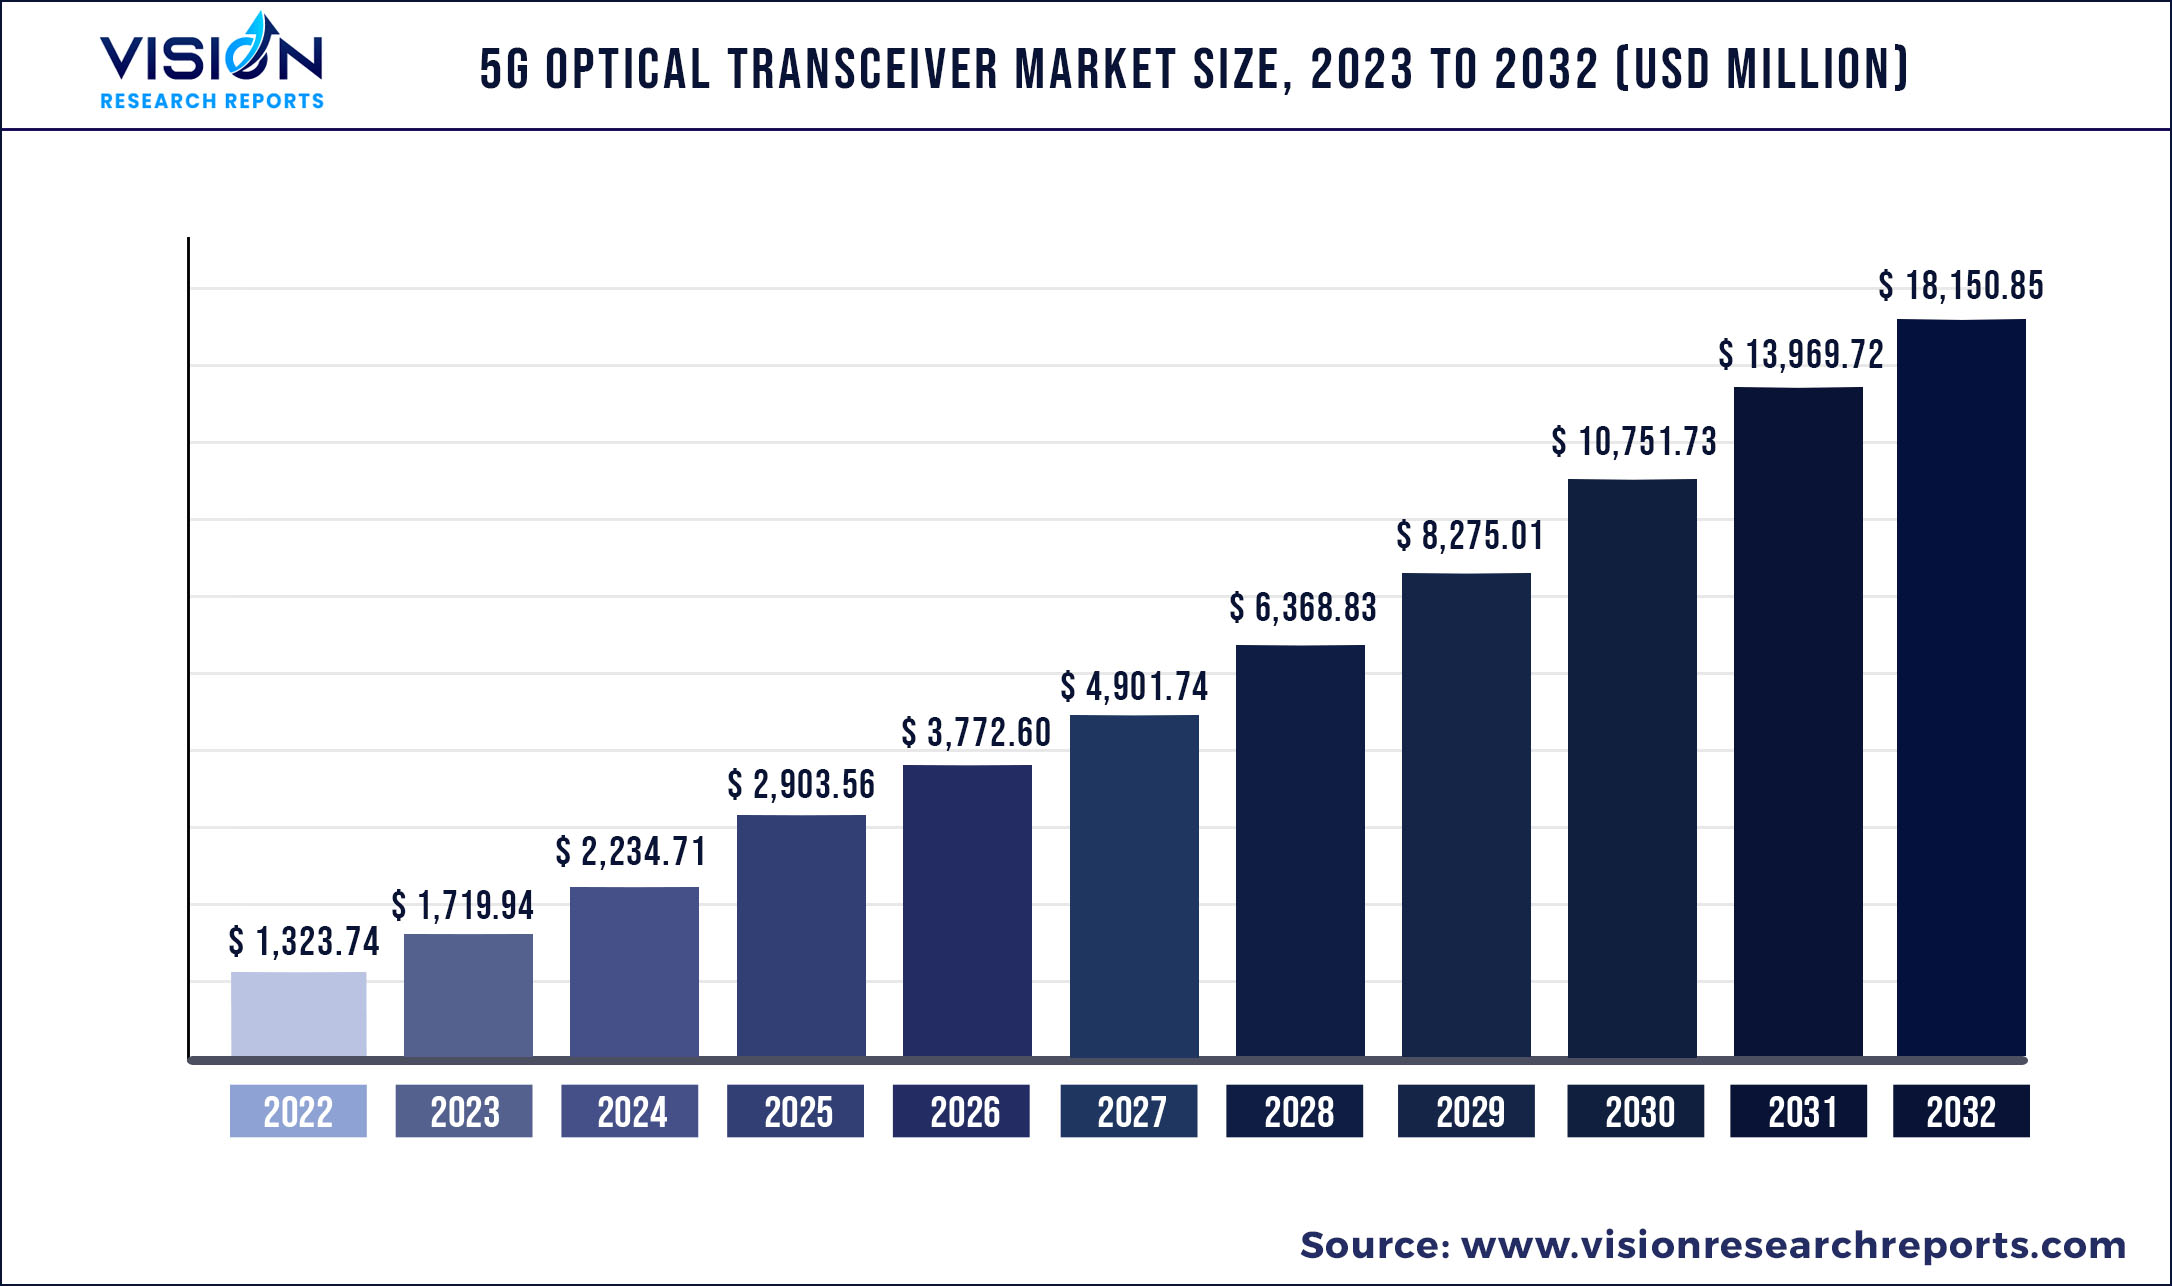
The global 5G optical transceiver market was valued at USD 1,323.74 million in 2022 and it is predicted to surpass around USD 18,150.85 million by 2032 with a CAGR of 29.93% from 2023 to 2032.
Key Pointers
Report Scope of the 5G Optical Transceiver Market
| Report Coverage | Details |
| Market Size in 2022 | USD 1,323.74 million |
| Revenue Forecast by 2032 | USD 18,150.85 million |
| Growth rate from 2023 to 2032 | CAGR of 29.93% |
| Base Year | 2022 |
| Forecast Period | 2023 to 2032 |
| Market Analysis (Terms Used) | Value (US$ Million/Billion) or (Volume/Units) |
| Regions Covered | North America, Europe, Asia Pacific, Latin America, Middle East & Africa |
| Companies Covered | II-VI Coherent Corp.; INNOLIGHT; HiSilicon Optoelectronics Co., Ltd.; Cisco Acacia Communications, Inc.; Hisense Broadband, Inc.; Broadcom.; Source Photonics; Juniper Networks, Inc.; Eoptolink Technology Inc.; Molex, LLC; Accelink Technology Co. Ltd; Fujitsu Optical Components Limited |
The optical transceiver is also known as a fiber optic transceiver, an interconnect component used to transmit and receive data. Optical transceiver leverages fiber optic technology to convert electrical signals to light and vice versa. Optical transceivers are a crucial component in 5G infrastructure’s fronthaul, backhaul, and midhaul. The growing demand for 5G is expected to drive the deployment of 5G optical transceivers in 5G infrastructure, thereby driving the market’s growth.
Optical transceivers are a core component of optical communication. In 5G communication, fiber optics transport 5G signals to and from the carrier’s wide area networks. According to research published by IEEE Communications Society, optical transceivers are essential components of 5G fronthaul, midhaul, and backhaul, and their costs account for around 50% to 70% of the total 5G network costs.
The demand for 5G is expected to rise significantly over the forecast period driving the demand for 5g optical transceivers. Telefonaktiebolaget LM Ericsson’s ‘Mobility Report’ predicts that 5G subscriptions will reach 5 billion by 2028. The growing demand for 5G infrastructure is expected to propel the 5G optical transceiver industry’s growth.
With the continuous roll-out of 5G, consumer expectations are shifting to high data rates. Telecom suppliers and 5G providers are focusing on increasingly moving towards the 800 Gbps optical ecosystem to keep pace with massive growth in data requirements and shifting consumer demand.
Additionally, 5G providers are looking for infrastructure components to help them achieve high bandwidth data transmission while keeping low costs and power consumption. To address these criteria, the optical transceiver market is looking to leverage Silicon-Photonic technology, which is expected to play a crucial role in driving the adoption of 5G optical transceivers over the forecast period.
Telecommunication providers are increasingly adopting 5G optical transceivers to support their 5G roll-outs. For instance, in October 2022, SoftBank Corp., a Japanese telecommunication service provider, announced that it would deploy Cisco QSFP ZR4 pluggable optical transceivers to support its 4G/5G, broadband, and enterprise services.
By leveraging these optical transceivers, SoftBank Corp. aims to reduce power consumption and carbon footprint, providing faster connectivity. The ability of 5G optical transceivers to provide higher network efficiency and high reliability and its ability to consume less rack space and low power consumption is contributing to operational efficiency and sustainability, thus driving the market demand.
As of December 2022, 5G networks are being deployed only in parts of the world, and many countries across the globe are still majorly using 4G and even 3G networks, which can hinder the adoption of 5G optical transceivers. However, the demand for 5G networks is expected to increase over the forecast period, which comes with its own operational complexities.
As the demand for 5G increases, building standalone 5G infrastructure will become necessary. Building and maintaining 5G standalone infrastructure can be expensive and require significant investments in equipment. Hence, the growth of the 5G optical transceiver market depends on significant investments made by key market players in deploying 5G infrastructure.
5G Optical Transceiver Market Segmentations:
| By Type | By Form Factor | By Wavelength | By Distance | By 5G Infrastructure |
|
25G Transceivers 50G Transceivers 100G Transceivers 200G Transceivers 400G Transceivers |
SFP28 SFP56 QSFP28 Others (QSFP56, CFP2, CFP8) |
850 nm band 1310 nm band Others (CWDM, DWDM, LWDM, 1270nm, 1330 nm) |
1 to 10 Km 10 to 100 Km More than 100 Km |
5G FrontHaul 5G MidHaul/BackHaul |
Chapter 1. Introduction
1.1. Research Objective
1.2. Scope of the Study
1.3. Definition
Chapter 2. Research Methodology
2.1. Research Approach
2.2. Data Sources
2.3. Assumptions & Limitations
Chapter 3. Executive Summary
3.1. Market Snapshot
Chapter 4. Market Variables and Scope
4.1. Introduction
4.2. Market Classification and Scope
4.3. Industry Value Chain Analysis
4.3.1. Raw Material Procurement Analysis
4.3.2. Sales and Distribution Channel Analysis
4.3.3. Downstream Buyer Analysis
Chapter 5. COVID 19 Impact on 5G Optical Transceiver Market
5.1. COVID-19 Landscape: 5G Optical Transceiver Industry Impact
5.2. COVID 19 - Impact Assessment for the Industry
5.3. COVID 19 Impact: Global Major Government Policy
5.4. Market Trends and Opportunities in the COVID-19 Landscape
Chapter 6. Market Dynamics Analysis and Trends
6.1. Market Dynamics
6.1.1. Market Drivers
6.1.2. Market Restraints
6.1.3. Market Opportunities
6.2. Porter’s Five Forces Analysis
6.2.1. Bargaining power of suppliers
6.2.2. Bargaining power of buyers
6.2.3. Threat of substitute
6.2.4. Threat of new entrants
6.2.5. Degree of competition
Chapter 7. Competitive Landscape
7.1.1. Company Market Share/Positioning Analysis
7.1.2. Key Strategies Adopted by Players
7.1.3. Vendor Landscape
7.1.3.1. List of Suppliers
7.1.3.2. List of Buyers
Chapter 8. Global 5G Optical Transceiver Market, By Type
8.1. 5G Optical Transceiver Market, by Type, 2023-2032
8.1.1. 25G Transceivers
8.1.1.1. Market Revenue and Forecast (2020-2032)
8.1.2. 50G Transceivers
8.1.2.1. Market Revenue and Forecast (2020-2032)
8.1.3. 100G Transceivers
8.1.3.1. Market Revenue and Forecast (2020-2032)
8.1.4. 200G Transceivers
8.1.4.1. Market Revenue and Forecast (2020-2032)
8.1.5. 400G Transceivers
8.1.5.1. Market Revenue and Forecast (2020-2032)
Chapter 9. Global 5G Optical Transceiver Market, By Form Factor
9.1. 5G Optical Transceiver Market, by Form Factor, 2023-2032
9.1.1. SFP28
9.1.1.1. Market Revenue and Forecast (2020-2032)
9.1.2. SFP56
9.1.2.1. Market Revenue and Forecast (2020-2032)
9.1.3. QSFP28
9.1.3.1. Market Revenue and Forecast (2020-2032)
9.1.4. Others (QSFP56, CFP2, CFP8)
9.1.4.1. Market Revenue and Forecast (2020-2032)
Chapter 10. Global 5G Optical Transceiver Market, By Wavelength
10.1. 5G Optical Transceiver Market, by Wavelength, 2023-2032
10.1.1. 850 nm band
10.1.1.1. Market Revenue and Forecast (2020-2032)
10.1.2. 1310 nm band
10.1.2.1. Market Revenue and Forecast (2020-2032)
10.1.3. Others (CWDM, DWDM, LWDM, 1270nm, 1330 nm)
10.1.3.1. Market Revenue and Forecast (2020-2032)
Chapter 11. Global 5G Optical Transceiver Market, By Distance
11.1. 5G Optical Transceiver Market, by Distance, 2023-2032
11.1.1. 1 to 10 Km
11.1.1.1. Market Revenue and Forecast (2020-2032)
11.1.2. 10 to 100 Km
11.1.2.1. Market Revenue and Forecast (2020-2032)
11.1.3. More than 100 Km
11.1.3.1. Market Revenue and Forecast (2020-2032)
Chapter 12. Global 5G Optical Transceiver Market, By 5G Infrastructure
12.1. 5G Optical Transceiver Market, by 5G Infrastructure, 2023-2032
12.1.1. 5G FrontHaul
12.1.1.1. Market Revenue and Forecast (2020-2032)
12.1.2. 5G MidHaul/BackHaul
12.1.2.1. Market Revenue and Forecast (2020-2032)
Chapter 13. Global 5G Optical Transceiver Market, Regional Estimates and Trend Forecast
13.1. North America
13.1.1. Market Revenue and Forecast, by Type (2020-2032)
13.1.2. Market Revenue and Forecast, by Form Factor (2020-2032)
13.1.3. Market Revenue and Forecast, by Wavelength (2020-2032)
13.1.4. Market Revenue and Forecast, by Distance (2020-2032)
13.1.5. Market Revenue and Forecast, by 5G Infrastructure (2020-2032)
13.1.6. U.S.
13.1.6.1. Market Revenue and Forecast, by Type (2020-2032)
13.1.6.2. Market Revenue and Forecast, by Form Factor (2020-2032)
13.1.6.3. Market Revenue and Forecast, by Wavelength (2020-2032)
13.1.6.4. Market Revenue and Forecast, by Distance (2020-2032)
13.1.7. Market Revenue and Forecast, by 5G Infrastructure (2020-2032)
13.1.8. Rest of North America
13.1.8.1. Market Revenue and Forecast, by Type (2020-2032)
13.1.8.2. Market Revenue and Forecast, by Form Factor (2020-2032)
13.1.8.3. Market Revenue and Forecast, by Wavelength (2020-2032)
13.1.8.4. Market Revenue and Forecast, by Distance (2020-2032)
13.1.8.5. Market Revenue and Forecast, by 5G Infrastructure (2020-2032)
13.2. Europe
13.2.1. Market Revenue and Forecast, by Type (2020-2032)
13.2.2. Market Revenue and Forecast, by Form Factor (2020-2032)
13.2.3. Market Revenue and Forecast, by Wavelength (2020-2032)
13.2.4. Market Revenue and Forecast, by Distance (2020-2032)
13.2.5. Market Revenue and Forecast, by 5G Infrastructure (2020-2032)
13.2.6. UK
13.2.6.1. Market Revenue and Forecast, by Type (2020-2032)
13.2.6.2. Market Revenue and Forecast, by Form Factor (2020-2032)
13.2.6.3. Market Revenue and Forecast, by Wavelength (2020-2032)
13.2.7. Market Revenue and Forecast, by Distance (2020-2032)
13.2.8. Market Revenue and Forecast, by 5G Infrastructure (2020-2032)
13.2.9. Germany
13.2.9.1. Market Revenue and Forecast, by Type (2020-2032)
13.2.9.2. Market Revenue and Forecast, by Form Factor (2020-2032)
13.2.9.3. Market Revenue and Forecast, by Wavelength (2020-2032)
13.2.10. Market Revenue and Forecast, by Distance (2020-2032)
13.2.11. Market Revenue and Forecast, by 5G Infrastructure (2020-2032)
13.2.12. France
13.2.12.1. Market Revenue and Forecast, by Type (2020-2032)
13.2.12.2. Market Revenue and Forecast, by Form Factor (2020-2032)
13.2.12.3. Market Revenue and Forecast, by Wavelength (2020-2032)
13.2.12.4. Market Revenue and Forecast, by Distance (2020-2032)
13.2.13. Market Revenue and Forecast, by 5G Infrastructure (2020-2032)
13.2.14. Rest of Europe
13.2.14.1. Market Revenue and Forecast, by Type (2020-2032)
13.2.14.2. Market Revenue and Forecast, by Form Factor (2020-2032)
13.2.14.3. Market Revenue and Forecast, by Wavelength (2020-2032)
13.2.14.4. Market Revenue and Forecast, by Distance (2020-2032)
13.2.15. Market Revenue and Forecast, by 5G Infrastructure (2020-2032)
13.3. APAC
13.3.1. Market Revenue and Forecast, by Type (2020-2032)
13.3.2. Market Revenue and Forecast, by Form Factor (2020-2032)
13.3.3. Market Revenue and Forecast, by Wavelength (2020-2032)
13.3.4. Market Revenue and Forecast, by Distance (2020-2032)
13.3.5. Market Revenue and Forecast, by 5G Infrastructure (2020-2032)
13.3.6. India
13.3.6.1. Market Revenue and Forecast, by Type (2020-2032)
13.3.6.2. Market Revenue and Forecast, by Form Factor (2020-2032)
13.3.6.3. Market Revenue and Forecast, by Wavelength (2020-2032)
13.3.6.4. Market Revenue and Forecast, by Distance (2020-2032)
13.3.7. Market Revenue and Forecast, by 5G Infrastructure (2020-2032)
13.3.8. China
13.3.8.1. Market Revenue and Forecast, by Type (2020-2032)
13.3.8.2. Market Revenue and Forecast, by Form Factor (2020-2032)
13.3.8.3. Market Revenue and Forecast, by Wavelength (2020-2032)
13.3.8.4. Market Revenue and Forecast, by Distance (2020-2032)
13.3.9. Market Revenue and Forecast, by 5G Infrastructure (2020-2032)
13.3.10. Japan
13.3.10.1. Market Revenue and Forecast, by Type (2020-2032)
13.3.10.2. Market Revenue and Forecast, by Form Factor (2020-2032)
13.3.10.3. Market Revenue and Forecast, by Wavelength (2020-2032)
13.3.10.4. Market Revenue and Forecast, by Distance (2020-2032)
13.3.10.5. Market Revenue and Forecast, by 5G Infrastructure (2020-2032)
13.3.11. Rest of APAC
13.3.11.1. Market Revenue and Forecast, by Type (2020-2032)
13.3.11.2. Market Revenue and Forecast, by Form Factor (2020-2032)
13.3.11.3. Market Revenue and Forecast, by Wavelength (2020-2032)
13.3.11.4. Market Revenue and Forecast, by Distance (2020-2032)
13.3.11.5. Market Revenue and Forecast, by 5G Infrastructure (2020-2032)
13.4. MEA
13.4.1. Market Revenue and Forecast, by Type (2020-2032)
13.4.2. Market Revenue and Forecast, by Form Factor (2020-2032)
13.4.3. Market Revenue and Forecast, by Wavelength (2020-2032)
13.4.4. Market Revenue and Forecast, by Distance (2020-2032)
13.4.5. Market Revenue and Forecast, by 5G Infrastructure (2020-2032)
13.4.6. GCC
13.4.6.1. Market Revenue and Forecast, by Type (2020-2032)
13.4.6.2. Market Revenue and Forecast, by Form Factor (2020-2032)
13.4.6.3. Market Revenue and Forecast, by Wavelength (2020-2032)
13.4.6.4. Market Revenue and Forecast, by Distance (2020-2032)
13.4.7. Market Revenue and Forecast, by 5G Infrastructure (2020-2032)
13.4.8. North Africa
13.4.8.1. Market Revenue and Forecast, by Type (2020-2032)
13.4.8.2. Market Revenue and Forecast, by Form Factor (2020-2032)
13.4.8.3. Market Revenue and Forecast, by Wavelength (2020-2032)
13.4.8.4. Market Revenue and Forecast, by Distance (2020-2032)
13.4.9. Market Revenue and Forecast, by 5G Infrastructure (2020-2032)
13.4.10. South Africa
13.4.10.1. Market Revenue and Forecast, by Type (2020-2032)
13.4.10.2. Market Revenue and Forecast, by Form Factor (2020-2032)
13.4.10.3. Market Revenue and Forecast, by Wavelength (2020-2032)
13.4.10.4. Market Revenue and Forecast, by Distance (2020-2032)
13.4.10.5. Market Revenue and Forecast, by 5G Infrastructure (2020-2032)
13.4.11. Rest of MEA
13.4.11.1. Market Revenue and Forecast, by Type (2020-2032)
13.4.11.2. Market Revenue and Forecast, by Form Factor (2020-2032)
13.4.11.3. Market Revenue and Forecast, by Wavelength (2020-2032)
13.4.11.4. Market Revenue and Forecast, by Distance (2020-2032)
13.4.11.5. Market Revenue and Forecast, by 5G Infrastructure (2020-2032)
13.5. Latin America
13.5.1. Market Revenue and Forecast, by Type (2020-2032)
13.5.2. Market Revenue and Forecast, by Form Factor (2020-2032)
13.5.3. Market Revenue and Forecast, by Wavelength (2020-2032)
13.5.4. Market Revenue and Forecast, by Distance (2020-2032)
13.5.5. Market Revenue and Forecast, by 5G Infrastructure (2020-2032)
13.5.6. Brazil
13.5.6.1. Market Revenue and Forecast, by Type (2020-2032)
13.5.6.2. Market Revenue and Forecast, by Form Factor (2020-2032)
13.5.6.3. Market Revenue and Forecast, by Wavelength (2020-2032)
13.5.6.4. Market Revenue and Forecast, by Distance (2020-2032)
13.5.7. Market Revenue and Forecast, by 5G Infrastructure (2020-2032)
13.5.8. Rest of LATAM
13.5.8.1. Market Revenue and Forecast, by Type (2020-2032)
13.5.8.2. Market Revenue and Forecast, by Form Factor (2020-2032)
13.5.8.3. Market Revenue and Forecast, by Wavelength (2020-2032)
13.5.8.4. Market Revenue and Forecast, by Distance (2020-2032)
13.5.8.5. Market Revenue and Forecast, by 5G Infrastructure (2020-2032)
Chapter 14. Company Profiles
14.1. II-VI Coherent Corp.
14.1.1. Company Overview
14.1.2. Product Offerings
14.1.3. Financial Performance
14.1.4. Recent Initiatives
14.2. INNOLIGHT
14.2.1. Company Overview
14.2.2. Product Offerings
14.2.3. Financial Performance
14.2.4. Recent Initiatives
14.3. HiSilicon Optoelectronics Co., Ltd.
14.3.1. Company Overview
14.3.2. Product Offerings
14.3.3. Financial Performance
14.3.4. Recent Initiatives
14.4. Cisco Acacia Communications, Inc.
14.4.1. Company Overview
14.4.2. Product Offerings
14.4.3. Financial Performance
14.4.4. Recent Initiatives
14.5. Broadcom.
14.5.1. Company Overview
14.5.2. Product Offerings
14.5.3. Financial Performance
14.5.4. Recent Initiatives
14.6. Source Photonics
14.6.1. Company Overview
14.6.2. Product Offerings
14.6.3. Financial Performance
14.6.4. Recent Initiatives
14.7. Juniper Networks, Inc.
14.7.1. Company Overview
14.7.2. Product Offerings
14.7.3. Financial Performance
14.7.4. Recent Initiatives
14.8. Eoptolink Technology Inc.
14.8.1. Company Overview
14.8.2. Product Offerings
14.8.3. Financial Performance
14.8.4. Recent Initiatives
14.9. Molex, LLC
14.9.1. Company Overview
14.9.2. Product Offerings
14.9.3. Financial Performance
14.9.4. Recent Initiatives
14.10. Accelink Technology Co. Ltd
14.10.1. Company Overview
14.10.2. Product Offerings
14.10.3. Financial Performance
14.10.4. Recent Initiatives
Chapter 15. Research Methodology
15.1. Primary Research
15.2. Secondary Research
15.3. Assumptions
Chapter 16. Appendix
16.1. About Us
16.2. Glossary of Terms
 Cross-segment Market Size and Analysis for
Mentioned Segments
Additional Company Profiles (Upto 5 With No Cost)
Additional Countries (Apart From Mentioned Countries)
Country/Region-specific Report
Go To Market Strategy
Region Specific Market DynamicsRegion Level Market Share Import Export AnalysisProduction AnalysisOthers
Cross-segment Market Size and Analysis for
Mentioned Segments
Additional Company Profiles (Upto 5 With No Cost)
Additional Countries (Apart From Mentioned Countries)
Country/Region-specific Report
Go To Market Strategy
Region Specific Market DynamicsRegion Level Market Share Import Export AnalysisProduction AnalysisOthers