Activated Carbon Market Size, Trends, Share, Growth | Report 2023-2032
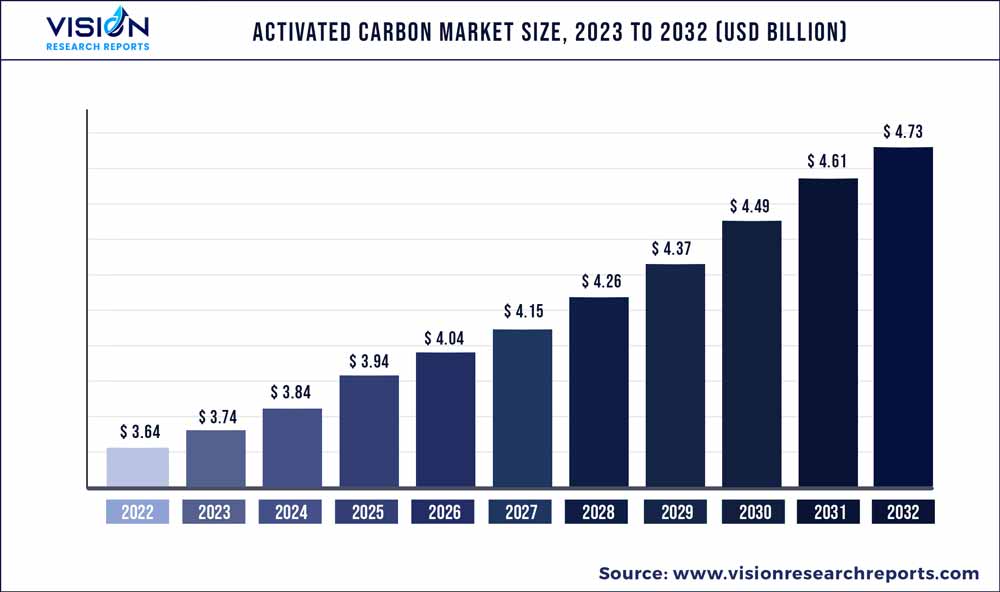
The global activated carbon market was valued at USD 3.64 billion in 2022 and it is predicted to surpass around USD 4.73 billion by 2032 with a CAGR of 2.65% from 2023 to 2032.
Key Pointers
Report Scope of the Activated Carbon Market
| Report Coverage | Details |
| Market Size in 2022 | USD 3.64 billion |
| Revenue Forecast by 2032 | USD 4.73 billion |
| Growth rate from 2023 to 2032 | CAGR of 2.65% |
| Base Year | 2022 |
| Forecast Period | 2023 to 2032 |
| Market Analysis (Terms Used) | Value (US$ Million/Billion) or (Volume/Units) |
| Regions Covered | North America, Europe, Asia Pacific, Latin America, Middle East & Africa |
| Companies Covered | CarbPure Technologies; Boyce Carbon; Cabot Corporation; Kuraray Co.; CarboTech AC GmbH; Donau Chemie AG; Haycarb (Pvt) Ltd.; Jacobi Carbons Group; Kureha Corporation; Osaka Gas Chemicals Co.; Ltd.; Evoqua Water Technologies LLC; Oxbow Activated Carbon LLC; Carbon Activated Corporation; Hangzhou Nature Technology Co.; Ltd.; Datong Coal Jinding Activated Carbon Co.; CarbUSA; Sorbent JSC |
The increase can be attributed by the need for a powdered and granular form is expected to increase as the demand for water and air purification in coal-fired plants grows and clinker cement industries.
Asia Pacific dominated the regional segment due to the growing industrialization in Japan and the developing economies. North America is another key region contributing to market growth due to stringent emission regulations in the region.
Various regulatory agencies have enacted strict environmental pollution control policies and encouraged the use in air and water treatment plants, which is expected to boost the market throughout the anticipated period. Implementation of regulations by various governments is expected to drive the product consumption in the forecast period.
The supply chain of the raw materials was drastically impacted by the COVID-19 outbreak, which further affected the production and consumption patterns globally. Powdered carbon type has dominated the product consumption since last decade. Consequently, halt in production of non-essential chemicals, ingredients or industrial products has drastically hampered demand. This resulted in negative impact on the market in 2020.
Type Insights
Powdered activated carbon (PAC) type dominated the market with a revenue share of 61.13% in 2022. PAC possesses high adsorption capacity, can fulfill broad treatment objectives and can remove a range of particulates. Companies such as Cabot Corporation doubled their activated carbon production capacity in Canada in 2014, to meet the growing demand of PAC. The company declared an addition of 35 million lbs/year PAC production capacity to sufficiently meet high demand of the product from coal-fired utility industry for mercury removal.
The granular activated carbon segment is also growing significantly. This can be attributed by its regenerating. GAC is heavily used in air treatment and municipal water treatment plants. Key raw material used in manufacturing of GAC are coal and coconut shell charcoal.
Form Insights
Gas form dominated the market with a revenue share of 52.51% in 2022. Growing demand for water treatment techniques resulting from standards & regulations mandating industries to adopt these methods is a critical factor that is expected to aid the market. Governments and agencies have issued such standards to safeguard the environment. These initiatives are presumed to aid the market over the forecast period.
Gas phase majorly includes air purification. Companies such as Kuraray Corporation and more are the key formulators of the product for gas phase applications. Within the air purification industry, activated carbon is broadly utilized in gas masks and air conditioners among others. In gas phase application, the product is also used for gas separation, solvent recovery and more. Gas-phase application is the fastest growing form which is anticipated to reach USD 24.96 billion by 2030 in terms of revenue and lead the market during the forecast period.
Liquid phase is the second largest revenue contributor globally. The market is driven from growing environmental concerns and regulations mandating companies to adopt environment friendly water treatment techniques. Companies such as Evoqua Water Technologies offers granular activated carbon for liquid phase applications including water treatment and more, under the brand AquaCarb and Westates.
End-use Insights
Water treatment end-use segment dominated the market with a revenue share of 42.83% in 2022.Water treatment technology is gaining utilization across the globe. Various companies globally are innovating & developing new technologies for water treatment recycling. Standards mandating companies to adopt efficient water disposal techniques and utilize environment-friendly compounds are presumed to further aid the market.
Air purification end-use accounted for the second largest revenue contributor globally in 2022. This is attributable to the rising demand from both domestic and commercial applications for air-conditioners and air-filters. Technological advancements coupled with rapidly rising disposable income as well as increasing affordability to opt for fresher air are presumed to aid the market over the forecast period.
Rising adsorbent applications in food & beverage, processing industry is expected to aid the market. Activated carbon have various advantages such as easy removal of bad tastes, cost- effective, quick and complete removal of bad odors provide long-term color stability. Owing to these advantages activated carbon are widely used in food and beverage processing.
Regional Insights
Asia Pacific dominated the market with a revenue share of 51.07% in 2022. This is because Asia Pacific is a good market for the procurement of coconut shells as well as coconut shell-based AC. Activated carbon is typically used for water purification and gold mining applications in the region. Indian dry coconuts are preferred over the coconuts of other countries in Asia Pacific because they have better oil content. Several major market participants, including Jacobi Carbons and Haycarb, source coconut shells from Asian countries such as Sri Lanka, Indonesia, the Philippines, and India.
The leading players in the market have a strong presence in the Asia Pacific region and continue to invest in organic growth through joint ventures and licensing agreements. North America is the second largest market after Asia Pacific. Growing automobile demand in the region, rise in geriatric population and increasing environmental concerns are projected to be the key factors positively impacting the market. PAC applications are expected to witness a brisk rise while gas phase applications are presumed to witness a similar trend.
Activated Carbon Market Segmentations:
By Type
By Application
By End-use
Chapter 1. Introduction
1.1. Research Objective
1.2. Scope of the Study
1.3. Definition
Chapter 2. Research Methodology
2.1. Research Approach
2.2. Data Sources
2.3. Assumptions & Limitations
Chapter 3. Executive Summary
3.1. Market Snapshot
Chapter 4. Market Variables and Scope
4.1. Introduction
4.2. Market Classification and Scope
4.3. Industry Value Chain Analysis
4.3.1. Raw Material Procurement Analysis
4.3.2. Sales and Distribution Type Analysis
4.3.3. Downstream Buyer Analysis
Chapter 5. COVID 19 Impact on Activated Carbon Market
5.1. COVID-19 Landscape: Activated Carbon Industry Impact
5.2. COVID 19 - Impact Assessment for the Industry
5.3. COVID 19 Impact: Global Major Government Policy
5.4. Market Trends and Opportunities in the COVID-19 Landscape
Chapter 6. Market Dynamics Analysis and Trends
6.1. Market Dynamics
6.1.1. Market Drivers
6.1.2. Market Restraints
6.1.3. Market Opportunities
6.2. Porter’s Five Forces Analysis
6.2.1. Bargaining power of suppliers
6.2.2. Bargaining power of buyers
6.2.3. Threat of substitute
6.2.4. Threat of new entrants
6.2.5. Degree of competition
Chapter 7. Competitive Landscape
7.1.1. Company Market Share/Positioning Analysis
7.1.2. Key Strategies Adopted by Players
7.1.3. Vendor Landscape
7.1.3.1. List of Suppliers
7.1.3.2. List of Buyers
Chapter 8. Global Activated Carbon Market, By Type
8.1. Activated Carbon Market, by Type, 2023-2032
8.1.1 Powdered
8.1.1.1. Market Revenue and Forecast (2020-2032)
8.1.2. Granular
8.1.2.1. Market Revenue and Forecast (2020-2032)
8.1.3. Others
8.1.3.1. Market Revenue and Forecast (2020-2032)
Chapter 9. Global Activated Carbon Market, By Application
9.1. Activated Carbon Market, by Application, 2023-2032
9.1.1. Liquid Phase
9.1.1.1. Market Revenue and Forecast (2020-2032)
9.1.2. Gas Phase
9.1.2.1. Market Revenue and Forecast (2020-2032)
Chapter 10. Global Activated Carbon Market, By End-use
10.1. Activated Carbon Market, by End-use, 2023-2032
10.1.1. Water Treatment
10.1.1.1. Market Revenue and Forecast (2020-2032)
10.1.2. Food & Beverage Processing
10.1.2.1. Market Revenue and Forecast (2020-2032)
10.1.3. Pharmaceutical & Medical
10.1.3.1. Market Revenue and Forecast (2020-2032)
10.1.4. Automotive
10.1.4.1. Market Revenue and Forecast (2020-2032)
10.1.5. Air Purification
10.1.5.1. Market Revenue and Forecast (2020-2032)
10.1.6. Others
10.1.6.1. Market Revenue and Forecast (2020-2032)
Chapter 11. Global Activated Carbon Market, Regional Estimates and Trend Forecast
11.1. North America
11.1.1. Market Revenue and Forecast, by Type (2020-2032)
11.1.2. Market Revenue and Forecast, by Application (2020-2032)
11.1.3. Market Revenue and Forecast, by End-use (2020-2032)
11.1.4. U.S.
11.1.4.1. Market Revenue and Forecast, by Type (2020-2032)
11.1.4.2. Market Revenue and Forecast, by Application (2020-2032)
11.1.4.3. Market Revenue and Forecast, by End-use (2020-2032)
11.1.5. Rest of North America
11.1.5.1. Market Revenue and Forecast, by Type (2020-2032)
11.1.5.2. Market Revenue and Forecast, by Application (2020-2032)
11.1.5.3. Market Revenue and Forecast, by End-use (2020-2032)
11.2. Europe
11.2.1. Market Revenue and Forecast, by Type (2020-2032)
11.2.2. Market Revenue and Forecast, by Application (2020-2032)
11.2.3. Market Revenue and Forecast, by End-use (2020-2032)
11.2.4. UK
11.2.4.1. Market Revenue and Forecast, by Type (2020-2032)
11.2.4.2. Market Revenue and Forecast, by Application (2020-2032)
11.2.4.3. Market Revenue and Forecast, by End-use (2020-2032)
11.2.5. Germany
11.2.5.1. Market Revenue and Forecast, by Type (2020-2032)
11.2.5.2. Market Revenue and Forecast, by Application (2020-2032)
11.2.5.3. Market Revenue and Forecast, by End-use (2020-2032)
11.2.6. France
11.2.6.1. Market Revenue and Forecast, by Type (2020-2032)
11.2.6.2. Market Revenue and Forecast, by Application (2020-2032)
11.2.6.3. Market Revenue and Forecast, by End-use (2020-2032)
11.2.7. Rest of Europe
11.2.7.1. Market Revenue and Forecast, by Type (2020-2032)
11.2.7.2. Market Revenue and Forecast, by Application (2020-2032)
11.2.7.3. Market Revenue and Forecast, by End-use (2020-2032)
11.3. APAC
11.3.1. Market Revenue and Forecast, by Type (2020-2032)
11.3.2. Market Revenue and Forecast, by Application (2020-2032)
11.3.3. Market Revenue and Forecast, by End-use (2020-2032)
11.3.4. India
11.3.4.1. Market Revenue and Forecast, by Type (2020-2032)
11.3.4.2. Market Revenue and Forecast, by Application (2020-2032)
11.3.4.3. Market Revenue and Forecast, by End-use (2020-2032)
11.3.5. China
11.3.5.1. Market Revenue and Forecast, by Type (2020-2032)
11.3.5.2. Market Revenue and Forecast, by Application (2020-2032)
11.3.5.3. Market Revenue and Forecast, by End-use (2020-2032)
11.3.6. Japan
11.3.6.1. Market Revenue and Forecast, by Type (2020-2032)
11.3.6.2. Market Revenue and Forecast, by Application (2020-2032)
11.3.6.3. Market Revenue and Forecast, by End-use (2020-2032)
11.3.7. Rest of APAC
11.3.7.1. Market Revenue and Forecast, by Type (2020-2032)
11.3.7.2. Market Revenue and Forecast, by Application (2020-2032)
11.3.7.3. Market Revenue and Forecast, by End-use (2020-2032)
11.4. MEA
11.4.1. Market Revenue and Forecast, by Type (2020-2032)
11.4.2. Market Revenue and Forecast, by Application (2020-2032)
11.4.3. Market Revenue and Forecast, by End-use (2020-2032)
11.4.4. GCC
11.4.4.1. Market Revenue and Forecast, by Type (2020-2032)
11.4.4.2. Market Revenue and Forecast, by Application (2020-2032)
11.4.4.3. Market Revenue and Forecast, by End-use (2020-2032)
11.4.5. North Africa
11.4.5.1. Market Revenue and Forecast, by Type (2020-2032)
11.4.5.2. Market Revenue and Forecast, by Application (2020-2032)
11.4.5.3. Market Revenue and Forecast, by End-use (2020-2032)
11.4.6. South Africa
11.4.6.1. Market Revenue and Forecast, by Type (2020-2032)
11.4.6.2. Market Revenue and Forecast, by Application (2020-2032)
11.4.6.3. Market Revenue and Forecast, by End-use (2020-2032)
11.4.7. Rest of MEA
11.4.7.1. Market Revenue and Forecast, by Type (2020-2032)
11.4.7.2. Market Revenue and Forecast, by Application (2020-2032)
11.4.7.3. Market Revenue and Forecast, by End-use (2020-2032)
11.5. Latin America
11.5.1. Market Revenue and Forecast, by Type (2020-2032)
11.5.2. Market Revenue and Forecast, by Application (2020-2032)
11.5.3. Market Revenue and Forecast, by End-use (2020-2032)
11.5.4. Brazil
11.5.4.1. Market Revenue and Forecast, by Type (2020-2032)
11.5.4.2. Market Revenue and Forecast, by Application (2020-2032)
11.5.4.3. Market Revenue and Forecast, by End-use (2020-2032)
11.5.5. Rest of LATAM
11.5.5.1. Market Revenue and Forecast, by Type (2020-2032)
11.5.5.2. Market Revenue and Forecast, by Application (2020-2032)
11.5.5.3. Market Revenue and Forecast, by End-use (2020-2032)
Chapter 12. Company Profiles
12.1. CarbPure Technologies
12.1.1. Company Overview
12.1.2. Product Offerings
12.1.3. Financial Performance
12.1.4. Recent Initiatives
12.2. Boyce Carbon
12.2.1. Company Overview
12.2.2. Product Offerings
12.2.3. Financial Performance
12.2.4. Recent Initiatives
12.3. Cabot Corporation
12.3.1. Company Overview
12.3.2. Product Offerings
12.3.3. Financial Performance
12.3.4. Recent Initiatives
12.4. Kuraray Co.
12.4.1. Company Overview
12.4.2. Product Offerings
12.4.3. Financial Performance
12.4.4. Recent Initiatives
12.5. CarboTech AC GmbH
12.5.1. Company Overview
12.5.2. Product Offerings
12.5.3. Financial Performance
12.5.4. Recent Initiatives
12.6. Donau Chemie AG
12.6.1. Company Overview
12.6.2. Product Offerings
12.6.3. Financial Performance
12.6.4. Recent Initiatives
12.7. Haycarb (Pvt) Ltd.
12.7.1. Company Overview
12.7.2. Product Offerings
12.7.3. Financial Performance
12.7.4. Recent Initiatives
12.8. Jacobi Carbons Group
12.8.1. Company Overview
12.8.2. Product Offerings
12.8.3. Financial Performance
12.8.4. Recent Initiatives
12.9. Kureha Corporation
12.9.1. Company Overview
12.9.2. Product Offerings
12.9.3. Financial Performance
12.9.4. Recent Initiatives
12.10. Osaka Gas Chemicals Co.; Ltd.
12.10.1. Company Overview
12.10.2. Product Offerings
12.10.3. Financial Performance
12.10.4. Recent Initiatives
Chapter 13. Research Methodology
13.1. Primary Research
13.2. Secondary Research
13.3. Assumptions
Chapter 14. Appendix
14.1. About Us
14.2. Glossary of Terms
 Cross-segment Market Size and Analysis for
Mentioned Segments
Additional Company Profiles (Upto 5 With No Cost)
Additional Countries (Apart From Mentioned Countries)
Country/Region-specific Report
Go To Market Strategy
Region Specific Market DynamicsRegion Level Market Share Import Export AnalysisProduction AnalysisOthers
Cross-segment Market Size and Analysis for
Mentioned Segments
Additional Company Profiles (Upto 5 With No Cost)
Additional Countries (Apart From Mentioned Countries)
Country/Region-specific Report
Go To Market Strategy
Region Specific Market DynamicsRegion Level Market Share Import Export AnalysisProduction AnalysisOthers