Automated Fare Collection Market Size, Share, Growth, Trends | Report 2023-2032
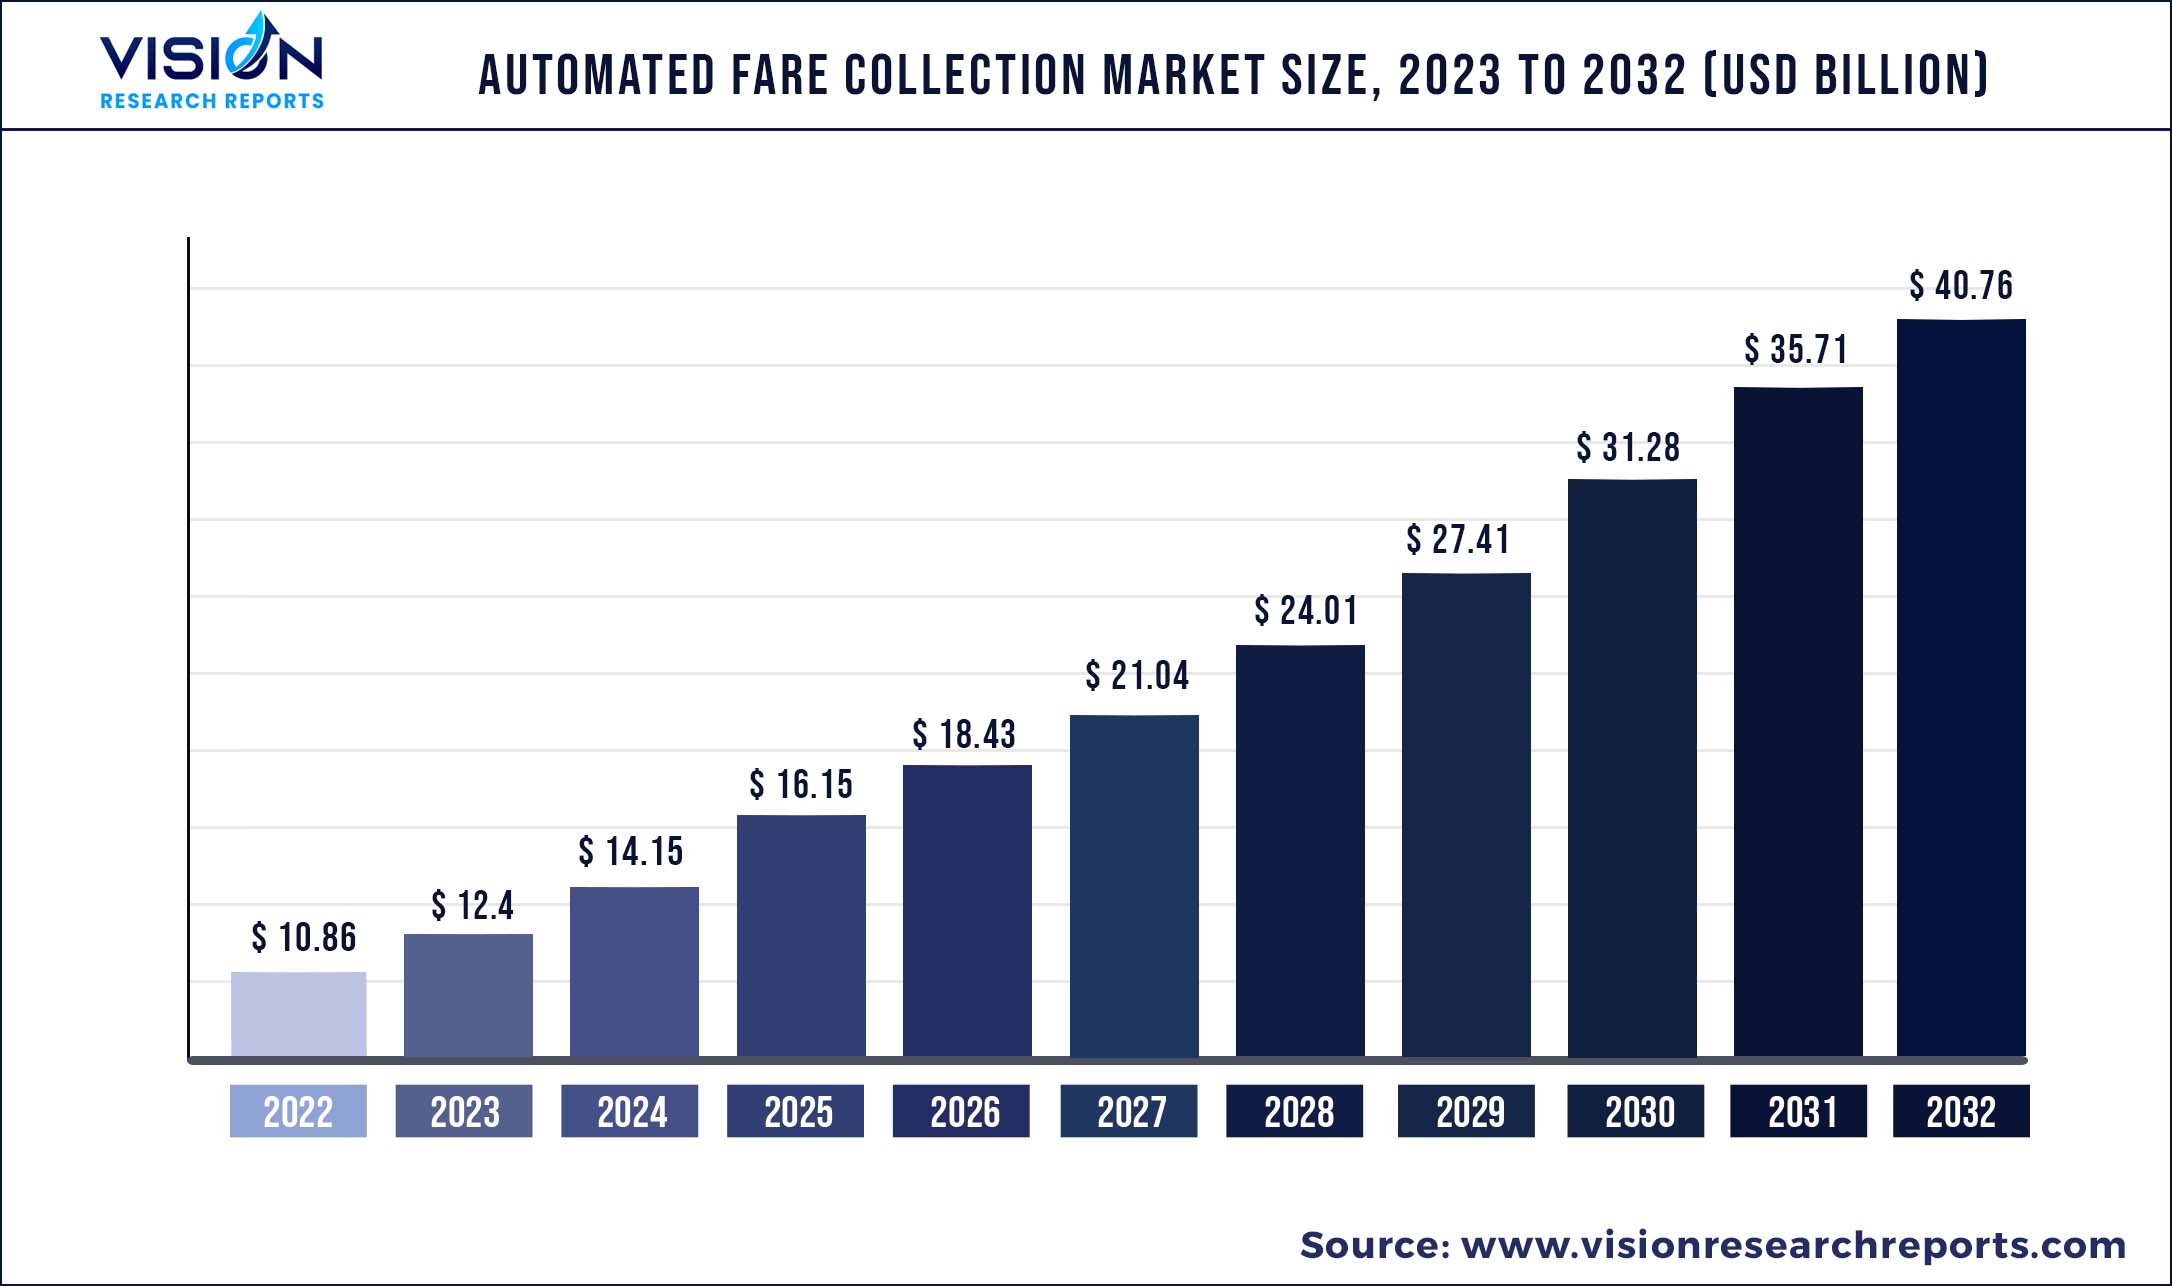
The global automated fare collection market was estimated at USD 10.86 billion in 2022 and it is expected to surpass around USD 40.76 billion by 2032, poised to grow at a CAGR of 14.14% from 2023 to 2032.
Key Pointers
Report Scope of the Automated Fare Collection Market
| Report Coverage | Details |
| Market Size in 2022 | USD 10.86 billion |
| Revenue Forecast by 2032 | USD 40.76 billion |
| Growth rate from 2023 to 2032 | CAGR of 14.14% |
| Base Year | 2022 |
| Forecast Period | 2023 to 2032 |
| Regions Covered | North America, Europe, Asia Pacific, Latin America, Middle East & Africa |
| Companies Covered | Advanced Card Systems Ltd.; Atos SE; Cubic Transportation Systems; GMV; Indra Sistemas SA; LECIP Holdings Corporation; LG Corporation; Siemens AG; Thales Group; Omron Corporation; Masabi Ltd.; Nippon Signal; Scheidt & Bachmann GmbH; Samsung SDS Co. Ltd |
Automated fare collection (AFC) reduces infrastructural costs by centrally managing the fare collection process thus, ensures transparency, and maintains key datasets & records. This reduces fraud, while simultaneously offering increased operational efficiency and ease of payment to customers. Furthermore, AFC reduces operational expenditures by minimizing manpower and other resources for fare collection and ensures a smooth flow of traffic during peak hours. Therefore, it is expected to drive the AFC industry growth during the forecast period.
The COVID-19 pandemic adversely affected the automated fare collection industry owing to the cancellation or postponement of various transportation projects in 2020 due to strict lockdowns imposed by various countries’ governments to curb the virus transmission. However, the market witnessed exponential growth since early 2021 due to supportive government initiatives in the transportation sector to accelerate the pandemic-affected economic growth. The rapid development of public infrastructure and transportation systems across developing economies along with the growing awareness for fast and reliable fare collection systems is driving the automated fare collection industry growth.
Furthermore, governments across developing economies are adopting various initiatives to promote automated fare collection systems. For instance, in June 2021, National Capital Region Transport Corporation (NCRTC), India announced the adoption of an automatic fare collection system for the Delhi-Ghaziabad-Meerut Regional Rapid Transit System (RRTS) corridor. This development aims to design an automated fare collection system build with QR Code based ticketing systems, vending machines, and pre-paid/credit/debit card readers. This will follow regulatory debit and credit card compliance for hassle-free cashless transactions along with ensuring a contactless entry and exit process for commuters.
Automated fare collection helps in avoiding fraud and minimizes revenue leakages by reducing the number of people from the system through the collection of fares and assigning tickets directly to the user. It helps eliminate practices such as unregistered tickets and black selling via real-time monitoring and tracking of operational processes. Furthermore, it also ensures the validity of the fare with the help of dynamic QR codes, and its design also embeds advanced AI algorithms and encryption to avoid duplication of tickets. These factors are expected to drive significant growth for the AFC industry during the forecast period.
Advancements in digital technologies such as big data analytics, Artificial Intelligence (AI), Machine Learning (ML), the Internet of Things (IoT), and cloud computing are creating new opportunities for players in the automated fare collection industry. These technologies ensure AI-based fraud detection techniques and offer a user-friendly interface on multiple devices and platforms for a seamless boarding process. These technologies also aggregate information and insights related to agencies, providers, media types, transaction types, routes, vehicle types, locations, and others. Along with the following features AFC offers flexible payment and settlement functionalities.
Automated Fare Collection Market Segmentations:
| By Component | By Technology | By System | By Application |
|
Hardware Software |
Smart Card Magnetic Stripe Near-field communication (NFC) Optical Character Recognition (OCR) |
Ticket Vending Machine (TVM) Ticket Office Machine (TOM) Fare Gates IC Cards |
Railways & Transportation Parking Entertainment Others (Government, Retail) |
Chapter 1. Introduction
1.1. Research Objective
1.2. Scope of the Study
1.3. Definition
Chapter 2. Research Methodology
2.1. Research Approach
2.2. Data Sources
2.3. Assumptions & Limitations
Chapter 3. Executive Summary
3.1. Market Snapshot
Chapter 4. Market Variables and Scope
4.1. Introduction
4.2. Market Classification and Scope
4.3. Industry Value Chain Analysis
4.3.1. Raw Material Procurement Analysis
4.3.2. Sales and Distribution Channel Analysis
4.3.3. Downstream Buyer Analysis
Chapter 5. COVID 19 Impact on Automated Fare Collection Market
5.1. COVID-19 Landscape: Automated Fare Collection Industry Impact
5.2. COVID 19 - Impact Assessment for the Industry
5.3. COVID 19 Impact: Global Major Government Policy
5.4. Market Trends and Opportunities in the COVID-19 Landscape
Chapter 6. Market Dynamics Analysis and Trends
6.1. Market Dynamics
6.1.1. Market Drivers
6.1.2. Market Restraints
6.1.3. Market Opportunities
6.2. Porter’s Five Forces Analysis
6.2.1. Bargaining power of suppliers
6.2.2. Bargaining power of buyers
6.2.3. Threat of substitute
6.2.4. Threat of new entrants
6.2.5. Degree of competition
Chapter 7. Competitive Landscape
7.1.1. Company Market Share/Positioning Analysis
7.1.2. Key Strategies Adopted by Players
7.1.3. Vendor Landscape
7.1.3.1. List of Suppliers
7.1.3.2. List of Buyers
Chapter 8. Global Automated Fare Collection Market, By Component
8.1. Automated Fare Collection Market, by Component, 2023-2032
8.1.1. Hardware
8.1.1.1. Market Revenue and Forecast (2020-2032)
8.1.2. Software
8.1.2.1. Market Revenue and Forecast (2020-2032)
Chapter 9. Global Automated Fare Collection Market, By Technology
9.1. Automated Fare Collection Market, by Technology, 2023-2032
9.1.1. Smart Card
9.1.1.1. Market Revenue and Forecast (2020-2032)
9.1.2. Magnetic Stripe
9.1.2.1. Market Revenue and Forecast (2020-2032)
9.1.3. Near-field communication (NFC)
9.1.3.1. Market Revenue and Forecast (2020-2032)
9.1.4. Optical Character Recognition (OCR)
9.1.4.1. Market Revenue and Forecast (2020-2032)
Chapter 10. Global Automated Fare Collection Market, By System
10.1. Automated Fare Collection Market, by System, 2023-2032
10.1.1. Ticket Vending Machine (TVM)
10.1.1.1. Market Revenue and Forecast (2020-2032)
10.1.2. Ticket Office Machine (TOM)
10.1.2.1. Market Revenue and Forecast (2020-2032)
10.1.3. Fare Gates
10.1.3.1. Market Revenue and Forecast (2020-2032)
10.1.4. IC Cards
10.1.4.1. Market Revenue and Forecast (2020-2032)
Chapter 11. Global Automated Fare Collection Market, By Application
11.1. Automated Fare Collection Market, by Application, 2023-2032
11.1.1. Railways & Transportation
11.1.1.1. Market Revenue and Forecast (2020-2032)
11.1.2. Parkin
11.1.2.1. Market Revenue and Forecast (2020-2032)
11.1.3. Entertainment
11.1.3.1. Market Revenue and Forecast (2020-2032)
11.1.4. Others (Government, Retail)
11.1.4.1. Market Revenue and Forecast (2020-2032)
Chapter 12. Global Automated Fare Collection Market, Regional Estimates and Trend Forecast
12.1. North America
12.1.1. Market Revenue and Forecast, by Component (2020-2032)
12.1.2. Market Revenue and Forecast, by Technology (2020-2032)
12.1.3. Market Revenue and Forecast, by System (2020-2032)
12.1.4. Market Revenue and Forecast, by Application (2020-2032)
12.1.5. U.S.
12.1.5.1. Market Revenue and Forecast, by Component (2020-2032)
12.1.5.2. Market Revenue and Forecast, by Technology (2020-2032)
12.1.5.3. Market Revenue and Forecast, by System (2020-2032)
12.1.5.4. Market Revenue and Forecast, by Application (2020-2032)
12.1.6. Rest of North America
12.1.6.1. Market Revenue and Forecast, by Component (2020-2032)
12.1.6.2. Market Revenue and Forecast, by Technology (2020-2032)
12.1.6.3. Market Revenue and Forecast, by System (2020-2032)
12.1.6.4. Market Revenue and Forecast, by Application (2020-2032)
12.2. Europe
12.2.1. Market Revenue and Forecast, by Component (2020-2032)
12.2.2. Market Revenue and Forecast, by Technology (2020-2032)
12.2.3. Market Revenue and Forecast, by System (2020-2032)
12.2.4. Market Revenue and Forecast, by Application (2020-2032)
12.2.5. UK
12.2.5.1. Market Revenue and Forecast, by Component (2020-2032)
12.2.5.2. Market Revenue and Forecast, by Technology (2020-2032)
12.2.5.3. Market Revenue and Forecast, by System (2020-2032)
12.2.5.4. Market Revenue and Forecast, by Application (2020-2032)
12.2.6. Germany
12.2.6.1. Market Revenue and Forecast, by Component (2020-2032)
12.2.6.2. Market Revenue and Forecast, by Technology (2020-2032)
12.2.6.3. Market Revenue and Forecast, by System (2020-2032)
12.2.6.4. Market Revenue and Forecast, by Application (2020-2032)
12.2.7. France
12.2.7.1. Market Revenue and Forecast, by Component (2020-2032)
12.2.7.2. Market Revenue and Forecast, by Technology (2020-2032)
12.2.7.3. Market Revenue and Forecast, by System (2020-2032)
12.2.7.4. Market Revenue and Forecast, by Application (2020-2032)
12.2.8. Rest of Europe
12.2.8.1. Market Revenue and Forecast, by Component (2020-2032)
12.2.8.2. Market Revenue and Forecast, by Technology (2020-2032)
12.2.8.3. Market Revenue and Forecast, by System (2020-2032)
12.2.8.4. Market Revenue and Forecast, by Application (2020-2032)
12.3. APAC
12.3.1. Market Revenue and Forecast, by Component (2020-2032)
12.3.2. Market Revenue and Forecast, by Technology (2020-2032)
12.3.3. Market Revenue and Forecast, by System (2020-2032)
12.3.4. Market Revenue and Forecast, by Application (2020-2032)
12.3.5. India
12.3.5.1. Market Revenue and Forecast, by Component (2020-2032)
12.3.5.2. Market Revenue and Forecast, by Technology (2020-2032)
12.3.5.3. Market Revenue and Forecast, by System (2020-2032)
12.3.5.4. Market Revenue and Forecast, by Application (2020-2032)
12.3.6. China
12.3.6.1. Market Revenue and Forecast, by Component (2020-2032)
12.3.6.2. Market Revenue and Forecast, by Technology (2020-2032)
12.3.6.3. Market Revenue and Forecast, by System (2020-2032)
12.3.6.4. Market Revenue and Forecast, by Application (2020-2032)
12.3.7. Japan
12.3.7.1. Market Revenue and Forecast, by Component (2020-2032)
12.3.7.2. Market Revenue and Forecast, by Technology (2020-2032)
12.3.7.3. Market Revenue and Forecast, by System (2020-2032)
12.3.7.4. Market Revenue and Forecast, by Application (2020-2032)
12.3.8. Rest of APAC
12.3.8.1. Market Revenue and Forecast, by Component (2020-2032)
12.3.8.2. Market Revenue and Forecast, by Technology (2020-2032)
12.3.8.3. Market Revenue and Forecast, by System (2020-2032)
12.3.8.4. Market Revenue and Forecast, by Application (2020-2032)
12.4. MEA
12.4.1. Market Revenue and Forecast, by Component (2020-2032)
12.4.2. Market Revenue and Forecast, by Technology (2020-2032)
12.4.3. Market Revenue and Forecast, by System (2020-2032)
12.4.4. Market Revenue and Forecast, by Application (2020-2032)
12.4.5. GCC
12.4.5.1. Market Revenue and Forecast, by Component (2020-2032)
12.4.5.2. Market Revenue and Forecast, by Technology (2020-2032)
12.4.5.3. Market Revenue and Forecast, by System (2020-2032)
12.4.5.4. Market Revenue and Forecast, by Application (2020-2032)
12.4.6. North Africa
12.4.6.1. Market Revenue and Forecast, by Component (2020-2032)
12.4.6.2. Market Revenue and Forecast, by Technology (2020-2032)
12.4.6.3. Market Revenue and Forecast, by System (2020-2032)
12.4.6.4. Market Revenue and Forecast, by Application (2020-2032)
12.4.7. South Africa
12.4.7.1. Market Revenue and Forecast, by Component (2020-2032)
12.4.7.2. Market Revenue and Forecast, by Technology (2020-2032)
12.4.7.3. Market Revenue and Forecast, by System (2020-2032)
12.4.7.4. Market Revenue and Forecast, by Application (2020-2032)
12.4.8. Rest of MEA
12.4.8.1. Market Revenue and Forecast, by Component (2020-2032)
12.4.8.2. Market Revenue and Forecast, by Technology (2020-2032)
12.4.8.3. Market Revenue and Forecast, by System (2020-2032)
12.4.8.4. Market Revenue and Forecast, by Application (2020-2032)
12.5. Latin America
12.5.1. Market Revenue and Forecast, by Component (2020-2032)
12.5.2. Market Revenue and Forecast, by Technology (2020-2032)
12.5.3. Market Revenue and Forecast, by System (2020-2032)
12.5.4. Market Revenue and Forecast, by Application (2020-2032)
12.5.5. Brazil
12.5.5.1. Market Revenue and Forecast, by Component (2020-2032)
12.5.5.2. Market Revenue and Forecast, by Technology (2020-2032)
12.5.5.3. Market Revenue and Forecast, by System (2020-2032)
12.5.5.4. Market Revenue and Forecast, by Application (2020-2032)
12.5.6. Rest of LATAM
12.5.6.1. Market Revenue and Forecast, by Component (2020-2032)
12.5.6.2. Market Revenue and Forecast, by Technology (2020-2032)
12.5.6.3. Market Revenue and Forecast, by System (2020-2032)
12.5.6.4. Market Revenue and Forecast, by Application (2020-2032)
Chapter 13. Company Profiles
13.1. Advanced Card Systems Ltd.
13.1.1. Company Overview
13.1.2. Product Offerings
13.1.3. Financial Performance
13.1.4. Recent Initiatives
13.2. Atos SE
13.2.1. Company Overview
13.2.2. Product Offerings
13.2.3. Financial Performance
13.2.4. Recent Initiatives
13.3. Cubic Transportation Systems
13.3.1. Company Overview
13.3.2. Product Offerings
13.3.3. Financial Performance
13.3.4. Recent Initiatives
13.4. GMV
13.4.1. Company Overview
13.4.2. Product Offerings
13.4.3. Financial Performance
13.4.4. Recent Initiatives
13.5. Indra Sistemas SA
13.5.1. Company Overview
13.5.2. Product Offerings
13.5.3. Financial Performance
13.5.4. Recent Initiatives
13.6. LECIP Holdings Corporation
13.6.1. Company Overview
13.6.2. Product Offerings
13.6.3. Financial Performance
13.6.4. Recent Initiatives
13.7. LG Corporation
13.7.1. Company Overview
13.7.2. Product Offerings
13.7.3. Financial Performance
13.7.4. Recent Initiatives
13.8. Siemens AG
13.8.1. Company Overview
13.8.2. Product Offerings
13.8.3. Financial Performance
13.8.4. Recent Initiatives
13.9. Thales Group
13.9.1. Company Overview
13.9.2. Product Offerings
13.9.3. Financial Performance
13.9.4. Recent Initiatives
13.10. Omron Corporation
13.10.1. Company Overview
13.10.2. Product Offerings
13.10.3. Financial Performance
13.10.4. Recent Initiatives
Chapter 14. Research Methodology
14.1. Primary Research
14.2. Secondary Research
14.3. Assumptions
Chapter 15. Appendix
15.1. About Us
15.2. Glossary of Terms
 Cross-segment Market Size and Analysis for
Mentioned Segments
Additional Company Profiles (Upto 5 With No Cost)
Additional Countries (Apart From Mentioned Countries)
Country/Region-specific Report
Go To Market Strategy
Region Specific Market DynamicsRegion Level Market Share Import Export AnalysisProduction AnalysisOthers
Cross-segment Market Size and Analysis for
Mentioned Segments
Additional Company Profiles (Upto 5 With No Cost)
Additional Countries (Apart From Mentioned Countries)
Country/Region-specific Report
Go To Market Strategy
Region Specific Market DynamicsRegion Level Market Share Import Export AnalysisProduction AnalysisOthers