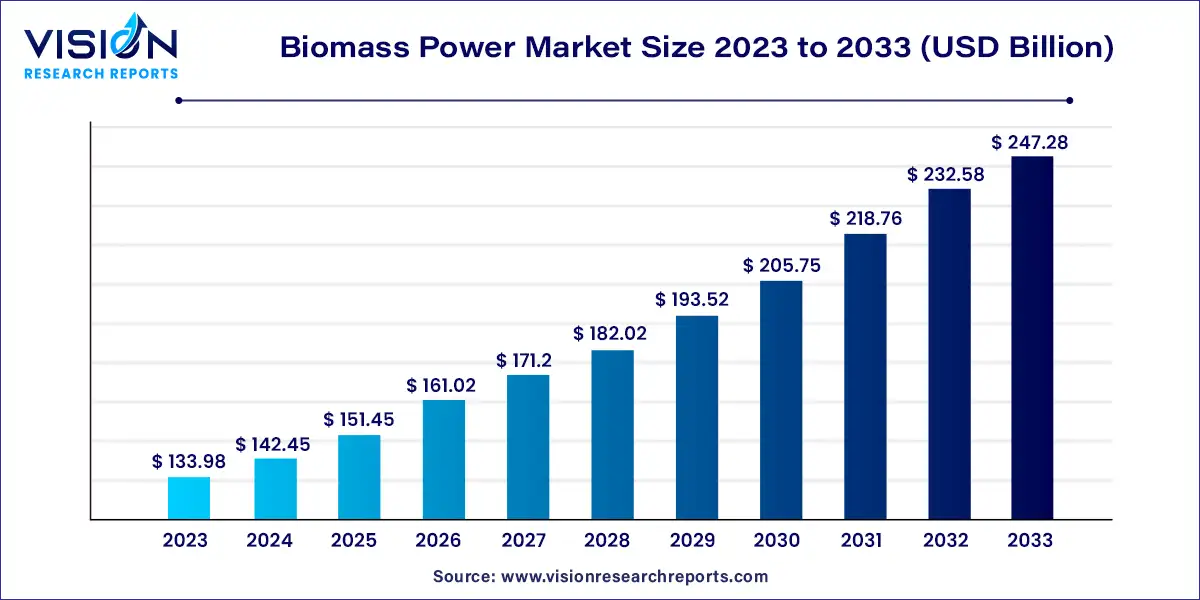
The global biomass power market size was estimated at around USD 133.98 billion in 2023 and it is projected to hit around USD 247.28 billion by 2033, growing at a CAGR of 6.32% from 2024 to 2033. The biomass power market is experiencing significant growth as a renewable energy source, driven by the need for sustainable energy solutions. Biomass power harnesses organic materials—such as agricultural residues, wood, and waste—to generate electricity and heat.

The growth of the biomass power market is fueled by an increasing global focus on reducing carbon emissions and mitigating climate change has led to a heightened demand for renewable energy sources, with biomass offering a sustainable alternative to fossil fuels. Secondly, government policies and incentives aimed at promoting renewable energy adoption significantly bolster market growth. These initiatives often include subsidies, tax credits, and renewable energy mandates that encourage investment in biomass projects. Additionally, technological advancements in biomass conversion processes are enhancing efficiency and reducing costs, making biomass power more competitive against traditional energy sources. Finally, the rising awareness among consumers and industries regarding environmental sustainability is driving the transition to greener energy solutions, further propelling the biomass power market forward.
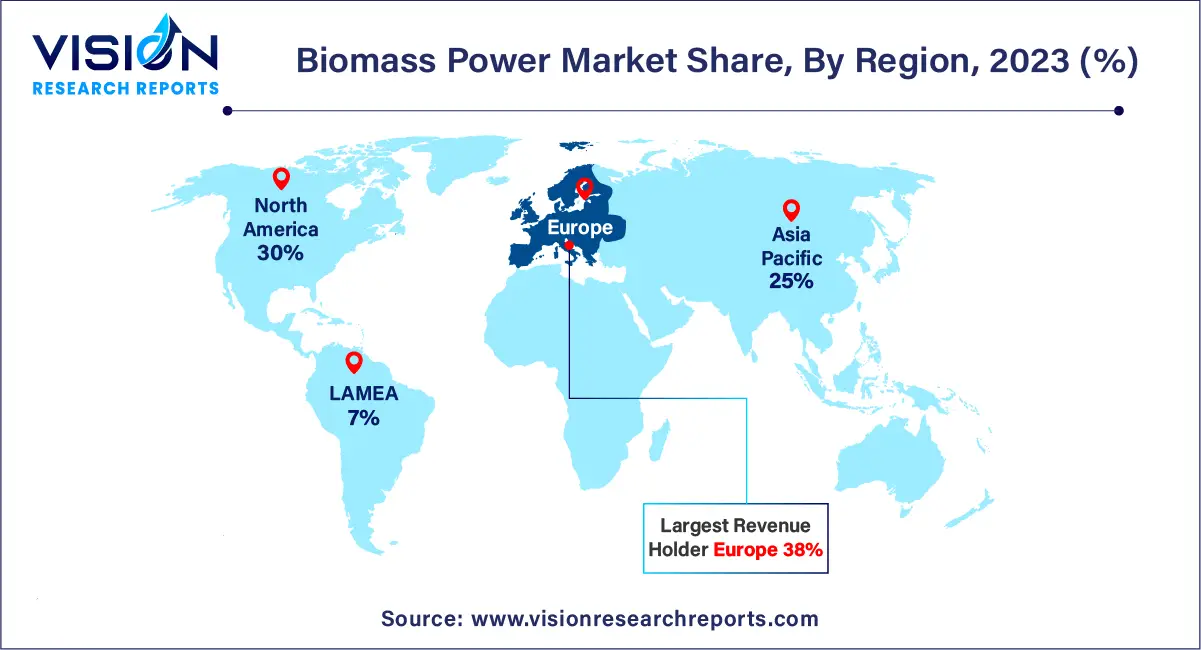
Europe led the market, capturing approximately 38% of the revenue share in 2023. The European Union has set ambitious goals to achieve carbon neutrality by 2050, aligning with commitments made under the Paris Agreement. The European Climate Law, enacted by the European Commission in March 2020, supports this objective, requiring EU member states to develop national strategies to meet their climate commitments.
| Attribute | Europe |
| Market Value | USD 50.91 Billion |
| Growth Rate | 6.33% CAGR |
| Projected Value | USD 93.96 Billion |
North America primarily relies on coal for power generation, but the recent discovery of shale gas reserves has shifted focus toward gas-based power generation, which has outpaced coal in growth over the past decade. Increasing environmental concerns have prompted North American countries to invest in renewable energy sources. Consequently, the U.S., Canada, and Mexico have enacted favorable policies and regulations to support renewable sources such as solar, wind, and biomass.

The U.S. biomass power market is experiencing growth driven by supportive government policies and the abundant availability of biomass feedstock. The energy landscape in the U.S. is shifting toward greater adoption of gas-based and renewable power sources over coal. According to the International Renewable Energy Agency (IRENA), the total bioenergy capacity in the U.S. reached 11.0 gigawatts (GW) in 2023.
The Asia Pacific biomass power market is set for significant growth, with a projected compound annual growth rate (CAGR) of over 10.83% between 2024 and 2033. This growth is driven by rising demand for biomass power in countries such as China, Japan, Thailand, and India.
In 2023, combustion technology emerged as the leading segment in the biomass power market, capturing approximately 89% of the share. This segment is anticipated to experience robust growth throughout the forecast period. In this process, biomass feedstock is combusted in a furnace with air, converting water into steam. The resulting steam drives a turbine to generate electricity. Combustion technology is favored for its straightforward operation and lower costs compared to more advanced biomass power technologies, positioning it as a preferred choice in the market moving forward.
Combustion remains the predominant method for converting solid biomass fuels into energy, accounting for over 80%-90% of global biomass energy generation. A significant portion of this energy is utilized for traditional cooking and heating applications.
Conversely, the gasification segment is projected to grow at the fastest rate during the forecast period. Gasification involves converting solid biomass into combustible gas through thermochemical reactions, yielding gas with a calorific value between 1,000 to 1,200 kcal/Nm³. Key advantages of gasification include its rapid processing time; gas can be produced within minutes, unlike biochemical conversion technologies, such as anaerobic digestion, which can take several days.
The solid biofuel segment held the largest market share of 86% in 2023 and is expected to register the highest growth during the forecast period. Solid biofuels comprise solid, organic materials of biological origin that are non-fossil-derived, utilized for either electricity generation or heat production. This category includes wood pellets, animal waste, fuelwood, vegetable materials, and wood residues. The dominance of solid biofuels in 2023 can be attributed to their easy availability and low cost, leading to greater adoption compared to liquid biofuels and biogas for power generation.
Liquid biofuels are anticipated to experience the fastest growth rate in the coming years. These fuels, derived from biomass or waste, can replace liquid fossil fuels for transportation and power generation. Examples include biodiesel, bio-gasoline, and bio-jet kerosene for the transportation sector, as well as crude vegetable oils and animal fats for power generation.
By Technology
By Feedstock
By Region
Chapter 1. Introduction
1.1. Research Objective
1.2. Scope of the Study
1.3. Definition
Chapter 2. Research Methodology
2.1. Research Approach
2.2. Data Sources
2.3. Assumptions & Limitations
Chapter 3. Executive Summary
3.1. Market Snapshot
Chapter 4. Market Variables and Scope
4.1. Introduction
4.2. Market Classification and Scope
4.3. Industry Value Chain Analysis
4.3.1. Raw Material Procurement Analysis
4.3.2. Sales and Distribution Channel Analysis
4.3.3. Downstream Buyer Analysis
Chapter 5. COVID 19 Impact on Biomass Power Market
5.1. COVID-19 Landscape: Biomass Power Industry Impact
5.2. COVID 19 - Impact Assessment for the Industry
5.3. COVID 19 Impact: Global Major Government Policy
5.4. Market Trends and Opportunities in the COVID-19 Landscape
Chapter 6. Market Dynamics Analysis and Trends
6.1. Market Dynamics
6.1.1. Market Drivers
6.1.2. Market Restraints
6.1.3. Market Opportunities
6.2. Porter’s Five Forces Analysis
6.2.1. Bargaining power of suppliers
6.2.2. Bargaining power of buyers
6.2.3. Threat of substitute
6.2.4. Threat of new entrants
6.2.5. Degree of competition
Chapter 7. Competitive Landscape
7.1.1. Company Market Share/Positioning Analysis
7.1.2. Key Strategies Adopted by Players
7.1.3. Vendor Landscape
7.1.3.1. List of Suppliers
7.1.3.2. List of Buyers
Chapter 8. Global Biomass Power Market, By Technology
8.1. Biomass Power Market, by Technology, 2024-2033
8.1.1. Combustion
8.1.1.1. Market Revenue and Forecast (2021-2033)
8.1.2. Gasification
8.1.2.1. Market Revenue and Forecast (2021-2033)
8.1.3. Anaerobic Digestion
8.1.3.1. Market Revenue and Forecast (2021-2033)
Chapter 9. Global Biomass Power Market, By Feedstock
9.1. Biomass Power Market, by Feedstock, 2024-2033
9.1.1. Solid Biofuel
9.1.1.1. Market Revenue and Forecast (2021-2033)
9.1.2. Liquid Biofuel
9.1.2.1. Market Revenue and Forecast (2021-2033)
9.1.3. Biogas
9.1.3.1. Market Revenue and Forecast (2021-2033)
Chapter 10. Global Biomass Power Market, Regional Estimates and Trend Forecast
10.1. North America
10.1.1. Market Revenue and Forecast, by Technology (2021-2033)
10.1.2. Market Revenue and Forecast, by Feedstock (2021-2033)
10.1.3. U.S.
10.1.3.1. Market Revenue and Forecast, by Technology (2021-2033)
10.1.3.2. Market Revenue and Forecast, by Feedstock (2021-2033)
10.1.4. Rest of North America
10.1.4.1. Market Revenue and Forecast, by Technology (2021-2033)
10.1.4.2. Market Revenue and Forecast, by Feedstock (2021-2033)
10.2. Europe
10.2.1. Market Revenue and Forecast, by Technology (2021-2033)
10.2.2. Market Revenue and Forecast, by Feedstock (2021-2033)
10.2.3. UK
10.2.3.1. Market Revenue and Forecast, by Technology (2021-2033)
10.2.3.2. Market Revenue and Forecast, by Feedstock (2021-2033)
10.2.4. Germany
10.2.4.1. Market Revenue and Forecast, by Technology (2021-2033)
10.2.4.2. Market Revenue and Forecast, by Feedstock (2021-2033)
10.2.5. France
10.2.5.1. Market Revenue and Forecast, by Technology (2021-2033)
10.2.5.2. Market Revenue and Forecast, by Feedstock (2021-2033)
10.2.6. Rest of Europe
10.2.6.1. Market Revenue and Forecast, by Technology (2021-2033)
10.2.6.2. Market Revenue and Forecast, by Feedstock (2021-2033)
10.3. APAC
10.3.1. Market Revenue and Forecast, by Technology (2021-2033)
10.3.2. Market Revenue and Forecast, by Feedstock (2021-2033)
10.3.3. India
10.3.3.1. Market Revenue and Forecast, by Technology (2021-2033)
10.3.3.2. Market Revenue and Forecast, by Feedstock (2021-2033)
10.3.4. China
10.3.4.1. Market Revenue and Forecast, by Technology (2021-2033)
10.3.4.2. Market Revenue and Forecast, by Feedstock (2021-2033)
10.3.5. Japan
10.3.5.1. Market Revenue and Forecast, by Technology (2021-2033)
10.3.5.2. Market Revenue and Forecast, by Feedstock (2021-2033)
10.3.6. Rest of APAC
10.3.6.1. Market Revenue and Forecast, by Technology (2021-2033)
10.3.6.2. Market Revenue and Forecast, by Feedstock (2021-2033)
10.4. MEA
10.4.1. Market Revenue and Forecast, by Technology (2021-2033)
10.4.2. Market Revenue and Forecast, by Feedstock (2021-2033)
10.4.3. GCC
10.4.3.1. Market Revenue and Forecast, by Technology (2021-2033)
10.4.3.2. Market Revenue and Forecast, by Feedstock (2021-2033)
10.4.4. North Africa
10.4.4.1. Market Revenue and Forecast, by Technology (2021-2033)
10.4.4.2. Market Revenue and Forecast, by Feedstock (2021-2033)
10.4.5. South Africa
10.4.5.1. Market Revenue and Forecast, by Technology (2021-2033)
10.4.5.2. Market Revenue and Forecast, by Feedstock (2021-2033)
10.4.6. Rest of MEA
10.4.6.1. Market Revenue and Forecast, by Technology (2021-2033)
10.4.6.2. Market Revenue and Forecast, by Feedstock (2021-2033)
10.5. Latin America
10.5.1. Market Revenue and Forecast, by Technology (2021-2033)
10.5.2. Market Revenue and Forecast, by Feedstock (2021-2033)
10.5.3. Brazil
10.5.3.1. Market Revenue and Forecast, by Technology (2021-2033)
10.5.3.2. Market Revenue and Forecast, by Feedstock (2021-2033)
10.5.4. Rest of LATAM
10.5.4.1. Market Revenue and Forecast, by Technology (2021-2033)
10.5.4.2. Market Revenue and Forecast, by Feedstock (2021-2033)
Chapter 11. Company Profiles
11.1. Mitsubishi Heavy Industries, Ltd.
11.1.1. Company Overview
11.1.2. Product Offerings
11.1.3. Financial Performance
11.1.4. Recent Initiatives
11.2. Suez
11.2.1. Company Overview
11.2.2. Product Offerings
11.2.3. Financial Performance
11.2.4. Recent Initiatives
11.3. Xcel Energy Inc.
11.3.1. Company Overview
11.3.2. Product Offerings
11.3.3. Financial Performance
11.3.4. Recent Initiatives
11.4. Ramboll Group A/S
11.4.1. Company Overview
11.4.2. Product Offerings
11.4.3. Financial Performance
11.4.4. LTE Scientific
11.5. Babcock & Wilcox Enterprises, Inc.
11.5.1. Company Overview
11.5.2. Product Offerings
11.5.3. Financial Performance
11.5.4. Recent Initiatives
11.6. Orsted A/S
11.6.1. Company Overview
11.6.2. Product Offerings
11.6.3. Financial Performance
11.6.4. Recent Initiatives
11.7. Ameresco
11.7.1. Company Overview
11.7.2. Product Offerings
11.7.3. Financial Performance
11.7.4. Recent Initiatives
11.8. General Electric
11.8.1. Company Overview
11.8.2. Product Offerings
11.8.3. Financial Performance
11.8.4. Recent Initiatives
11.9. Veolia
11.9.1. Company Overview
11.9.2. Product Offerings
11.9.3. Financial Performance
11.9.4. Recent Initiatives
11.10. Vattenfall
11.10.1. Company Overview
11.10.2. Product Offerings
11.10.3. Financial Performance
11.10.4. Recent Initiatives
Chapter 12. Research Methodology
12.1. Primary Research
12.2. Secondary Research
12.3. Assumptions
Chapter 13. Appendix
13.1. About Us
13.2. Glossary of Terms
 Cross-segment Market Size and Analysis for
Mentioned Segments
 Additional Company Profiles (Upto 5 With No Cost)
 Additional Countries (Apart From Mentioned Countries)
 Country/Region-specific Report
 Go To Market Strategy
 Region Specific Market Dynamics
 Region Level Market Share
 Import Export Analysis
 Production Analysis
 Others