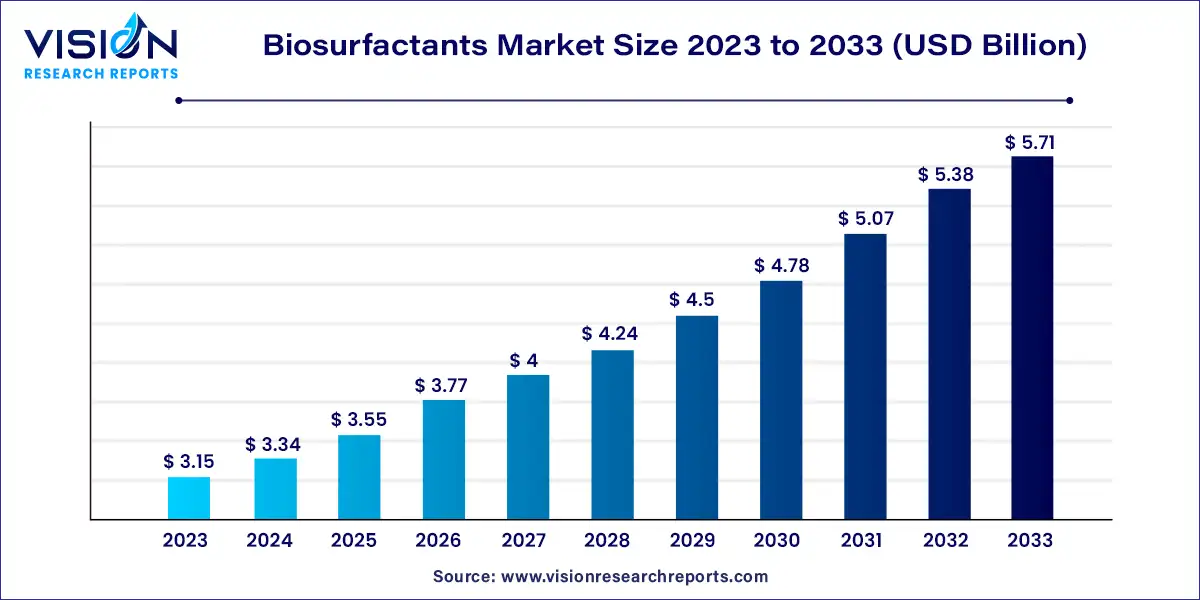
The global biosurfactants market size was estimated at USD 3.15 billion in 2023 and it is expected to surpass around USD 5.71 billion by 2033, poised to grow at a CAGR of 6.13% from 2024 to 2033. Biosurfactants are surface-active substances produced by microorganisms, offering sustainable and eco-friendly alternatives to synthetic surfactants derived from petrochemical sources. These compounds have gained considerable attention due to their biodegradable nature, low toxicity, and the ability to function under extreme conditions of pH, temperature, and salinity.
The growth of the biosurfactants market is primarily driven by an increasing demand for eco-friendly and sustainable products across various industries. As environmental regulations become stricter, manufacturers are seeking biodegradable alternatives to conventional synthetic surfactants. Biosurfactants, with their low toxicity and biodegradable properties, offer a suitable solution for industries like personal care, agriculture, and food processing. Additionally, growing awareness among consumers about the environmental impact of synthetic chemicals, coupled with rising demand for natural and organic products, is further fueling the market’s growth. Advancements in production technologies and innovations in microbial fermentation processes are also enhancing the commercial viability of biosurfactants, contributing to their increasing adoption worldwide.
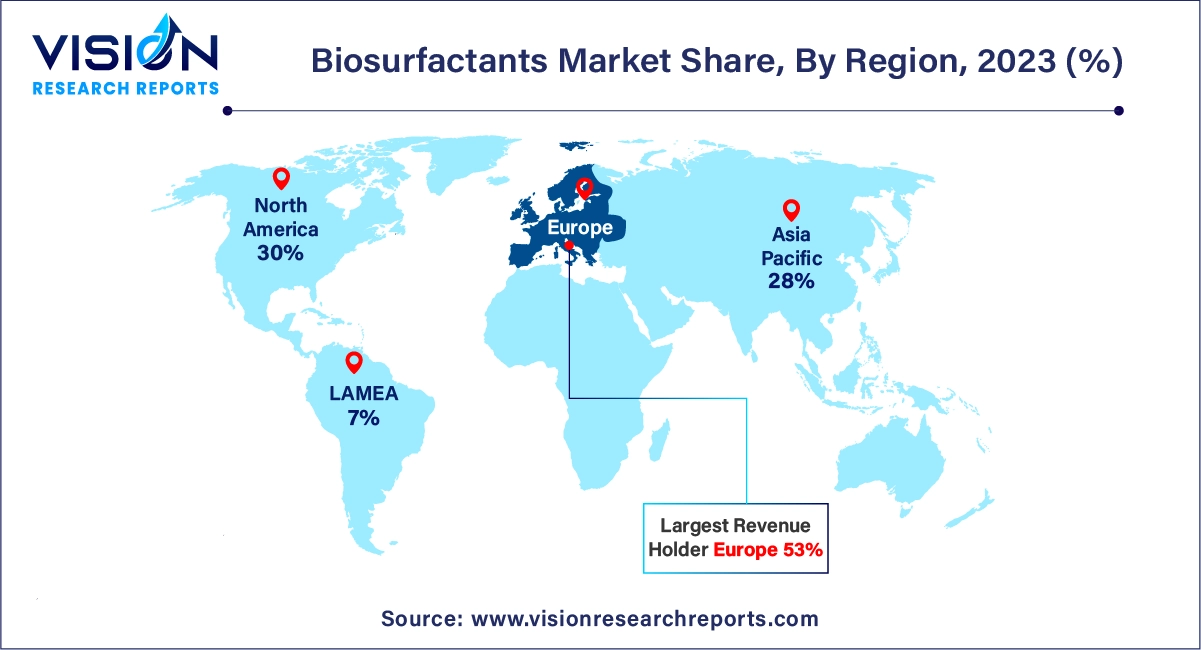
Europe led the global biosurfactants market with a 53% share in 2023. Growing awareness among manufacturers about the use of environmentally friendly alternatives is expected to drive market growth. Stringent regulations on chemicals that produce hazardous by-products or toxins are likely to further boost the market. The European Commission’s policy since 1970 to reduce surfactant content in detergents, aimed at preventing foaming in water systems and protecting marine environments, continues to influence market trends.
| Attribute | Europe |
| Market Value | USD 1.66 Billion |
| Growth Rate | 6.13% CAGR |
| Projected Value | USD 3.02 Billion |
The biosurfactants market in North America was notably lucrative in 2023. Rising concerns over the adverse effects of chemical surfactants and increased spending on health and cleanliness are expected to drive market growth. Additionally, the demand for biosurfactants in the petroleum and oil sector for enhanced oil recovery is anticipated to contribute to market expansion.

The Asia Pacific biosurfactants market is set to experience substantial growth. Increasing public concern about the environmental and health impacts of conventional surfactants is driving the adoption of biosurfactants in the region. Major markets such as China, Japan, India, and South Korea are leading this growth. The rising use of personal care and home care products, along with the implementation of environmentally friendly technologies, is expected to further accelerate market expansion in the coming years.
In 2023, MES held the largest market revenue share at 34%. Derived from renewable sources such as palm and coconut oil, MES offers a cost-effective and environmentally friendly alternative to synthetic surfactants. It is biodegradable, non-toxic, and provides excellent detergency, foaming, and wetting properties, making it ideal for various cleaning applications in laundry detergents, dishwashing soaps, and household products.
Rhamnolipids are projected to experience the highest growth rate, with a CAGR of 10.93% during the forecast period. These biosurfactants are gaining global attention due to their unique features and environmental benefits. Rhamnolipids, produced by bacteria like Pseudomonas aeruginosa, are effective in reducing surface tension, emulsifying, wetting, and foaming. As the industry moves towards more eco-friendly solutions, rhamnolipids are becoming increasingly popular across various applications.
Household detergents led the market with a 46% share in 2023. Biosurfactants, produced by microorganisms, are becoming popular as eco-friendly ingredients in household products. They are effective in dishwashing liquids, laundry detergents, and cleaning agents, offering efficient dirt, grease, and stain removal. Compared to conventional chemicals, biosurfactants are less toxic and more environmentally friendly, making them a safer option for homes with children and pets.
The personal care segment is expected to grow at the fastest CAGR of 6.33% over the forecast period. Biosurfactants are increasingly used in shampoos and body washes due to the rising demand for natural and gentle cosmetics. Their use enables products to be marketed as natural and eco-friendly, justifying higher prices. As consumer awareness of natural products grows, the personal care segment presents a promising opportunity for biosurfactants.
By Product
By Application
By Region
Chapter 1. Introduction
1.1. Research Objective
1.2. Scope of the Study
1.3. Definition
Chapter 2. Research Methodology
2.1. Research Approach
2.2. Data Sources
2.3. Assumptions & Limitations
Chapter 3. Executive Summary
3.1. Market Snapshot
Chapter 4. Market Variables and Scope
4.1. Introduction
4.2. Market Classification and Scope
4.3. Industry Value Chain Analysis
4.3.1. Raw Material Procurement Analysis
4.3.2. Sales and Distribution Channel Analysis
4.3.3. Downstream Buyer Analysis
Chapter 5. COVID 19 Impact on Biosurfactants Market
5.1. COVID-19 Landscape: Biosurfactants Industry Impact
5.2. COVID 19 - Impact Assessment for the Industry
5.3. COVID 19 Impact: Global Major Government Policy
5.4. Market Trends and Opportunities in the COVID-19 Landscape
Chapter 6. Market Dynamics Analysis and Trends
6.1. Market Dynamics
6.1.1. Market Drivers
6.1.2. Market Restraints
6.1.3. Market Opportunities
6.2. Porter’s Five Forces Analysis
6.2.1. Bargaining power of suppliers
6.2.2. Bargaining power of buyers
6.2.3. Threat of substitute
6.2.4. Threat of new entrants
6.2.5. Degree of competition
Chapter 7. Competitive Landscape
7.1.1. Company Market Share/Positioning Analysis
7.1.2. Key Strategies Adopted by Players
7.1.3. Vendor Landscape
7.1.3.1. List of Suppliers
7.1.3.2. List of Buyers
Chapter 8. Global Biosurfactants Market, By Product
8.1. Biosurfactants Market, by Product, 2024-2033
8.1.1. Rhamnolipids
8.1.1.1. Market Revenue and Forecast (2021-2033)
8.1.2. Sophorolipids
8.1.2.1. Market Revenue and Forecast (2021-2033)
8.1.3. MES
8.1.3.1. Market Revenue and Forecast (2021-2033)
8.1.4. APG
8.1.4.1. Market Revenue and Forecast (2021-2033)
8.1.5. Sorbitan Esters
8.1.5.1. Market Revenue and Forecast (2021-2033)
8.1.6. Sucrose Easters
8.1.6.1. Market Revenue and Forecast (2021-2033)
8.1.7. Other Products
8.1.7.1. Market Revenue and Forecast (2021-2033)
Chapter 9. Global Biosurfactants Market, By Application
9.1. Biosurfactants Market, by Application, 2024-2033
9.1.1. Household Detergents
9.1.1.1. Market Revenue and Forecast (2021-2033)
9.1.2. Personal Care
9.1.2.1. Market Revenue and Forecast (2021-2033)
9.1.3. Industrial Cleaners
9.1.3.1. Market Revenue and Forecast (2021-2033)
9.1.4. Food Processing
9.1.4.1. Market Revenue and Forecast (2021-2033)
9.1.5. Oilfield Chemicals
9.1.5.1. Market Revenue and Forecast (2021-2033)
9.1.6. Agricultural Chemicals
9.1.6.1. Market Revenue and Forecast (2021-2033)
9.1.7. Textiles
9.1.7.1. Market Revenue and Forecast (2021-2033)
9.1.8. Other Markets
9.1.8.1. Market Revenue and Forecast (2021-2033)
Chapter 10. Global Biosurfactants Market, Regional Estimates and Trend Forecast
10.1. North America
10.1.1. Market Revenue and Forecast, by Product (2021-2033)
10.1.2. Market Revenue and Forecast, by Application (2021-2033)
10.1.3. U.S.
10.1.3.1. Market Revenue and Forecast, by Product (2021-2033)
10.1.3.2. Market Revenue and Forecast, by Application (2021-2033)
10.1.4. Rest of North America
10.1.4.1. Market Revenue and Forecast, by Product (2021-2033)
10.1.4.2. Market Revenue and Forecast, by Application (2021-2033)
10.2. Europe
10.2.1. Market Revenue and Forecast, by Product (2021-2033)
10.2.2. Market Revenue and Forecast, by Application (2021-2033)
10.2.3. UK
10.2.3.1. Market Revenue and Forecast, by Product (2021-2033)
10.2.3.2. Market Revenue and Forecast, by Application (2021-2033)
10.2.4. Germany
10.2.4.1. Market Revenue and Forecast, by Product (2021-2033)
10.2.4.2. Market Revenue and Forecast, by Application (2021-2033)
10.2.5. France
10.2.5.1. Market Revenue and Forecast, by Product (2021-2033)
10.2.5.2. Market Revenue and Forecast, by Application (2021-2033)
10.2.6. Rest of Europe
10.2.6.1. Market Revenue and Forecast, by Product (2021-2033)
10.2.6.2. Market Revenue and Forecast, by Application (2021-2033)
10.3. APAC
10.3.1. Market Revenue and Forecast, by Product (2021-2033)
10.3.2. Market Revenue and Forecast, by Application (2021-2033)
10.3.3. India
10.3.3.1. Market Revenue and Forecast, by Product (2021-2033)
10.3.3.2. Market Revenue and Forecast, by Application (2021-2033)
10.3.4. China
10.3.4.1. Market Revenue and Forecast, by Product (2021-2033)
10.3.4.2. Market Revenue and Forecast, by Application (2021-2033)
10.3.5. Japan
10.3.5.1. Market Revenue and Forecast, by Product (2021-2033)
10.3.5.2. Market Revenue and Forecast, by Application (2021-2033)
10.3.6. Rest of APAC
10.3.6.1. Market Revenue and Forecast, by Product (2021-2033)
10.3.6.2. Market Revenue and Forecast, by Application (2021-2033)
10.4. MEA
10.4.1. Market Revenue and Forecast, by Product (2021-2033)
10.4.2. Market Revenue and Forecast, by Application (2021-2033)
10.4.3. GCC
10.4.3.1. Market Revenue and Forecast, by Product (2021-2033)
10.4.3.2. Market Revenue and Forecast, by Application (2021-2033)
10.4.4. North Africa
10.4.4.1. Market Revenue and Forecast, by Product (2021-2033)
10.4.4.2. Market Revenue and Forecast, by Application (2021-2033)
10.4.5. South Africa
10.4.5.1. Market Revenue and Forecast, by Product (2021-2033)
10.4.5.2. Market Revenue and Forecast, by Application (2021-2033)
10.4.6. Rest of MEA
10.4.6.1. Market Revenue and Forecast, by Product (2021-2033)
10.4.6.2. Market Revenue and Forecast, by Application (2021-2033)
10.5. Latin America
10.5.1. Market Revenue and Forecast, by Product (2021-2033)
10.5.2. Market Revenue and Forecast, by Application (2021-2033)
10.5.3. Brazil
10.5.3.1. Market Revenue and Forecast, by Product (2021-2033)
10.5.3.2. Market Revenue and Forecast, by Application (2021-2033)
10.5.4. Rest of LATAM
10.5.4.1. Market Revenue and Forecast, by Product (2021-2033)
10.5.4.2. Market Revenue and Forecast, by Application (2021-2033)
Chapter 11. Company Profiles
11.1. Evonik Industries AG
11.1.1. Company Overview
11.1.2. Product Offerings
11.1.3. Financial Performance
11.1.4. Recent Initiatives
11.2. Allied Carbon Solutions Co., Ltd.
11.2.1. Company Overview
11.2.2. Product Offerings
11.2.3. Financial Performance
11.2.4. Recent Initiatives
11.3. Saraya Co., Ltd.
11.3.1. Company Overview
11.3.2. Product Offerings
11.3.3. Financial Performance
11.3.4. Recent Initiatives
11.4. Jeneil Biotech, Inc.
11.4.1. Company Overview
11.4.2. Product Offerings
11.4.3. Financial Performance
11.4.4. LTE Scientific
11.5. Solvay S.A.
11.5.1. Company Overview
11.5.2. Product Offerings
11.5.3. Financial Performance
11.5.4. Recent Initiatives
11.6. Givaudan
11.6.1. Company Overview
11.6.2. Product Offerings
11.6.3. Financial Performance
11.6.4. Recent Initiatives
11.7. Synthezyme LLC
11.7.1. Company Overview
11.7.2. Product Offerings
11.7.3. Financial Performance
11.7.4. Recent Initiatives
11.8. Kaneka Corporation
11.8.1. Company Overview
11.8.2. Product Offerings
11.8.3. Financial Performance
11.8.4. Recent Initiatives
11.9. GlycoSurf LLC
11.9.1. Company Overview
11.9.2. Product Offerings
11.9.3. Financial Performance
11.9.4. Recent Initiatives
11.10. Stepan Company
11.10.1. Company Overview
11.10.2. Product Offerings
11.10.3. Financial Performance
11.10.4. Recent Initiatives
Chapter 12. Research Methodology
12.1. Primary Research
12.2. Secondary Research
12.3. Assumptions
Chapter 13. Appendix
13.1. About Us
13.2. Glossary of Terms
 Cross-segment Market Size and Analysis for
Mentioned Segments
 Additional Company Profiles (Upto 5 With No Cost)
 Additional Countries (Apart From Mentioned Countries)
 Country/Region-specific Report
 Go To Market Strategy
 Region Specific Market Dynamics
 Region Level Market Share
 Import Export Analysis
 Production Analysis
 Others