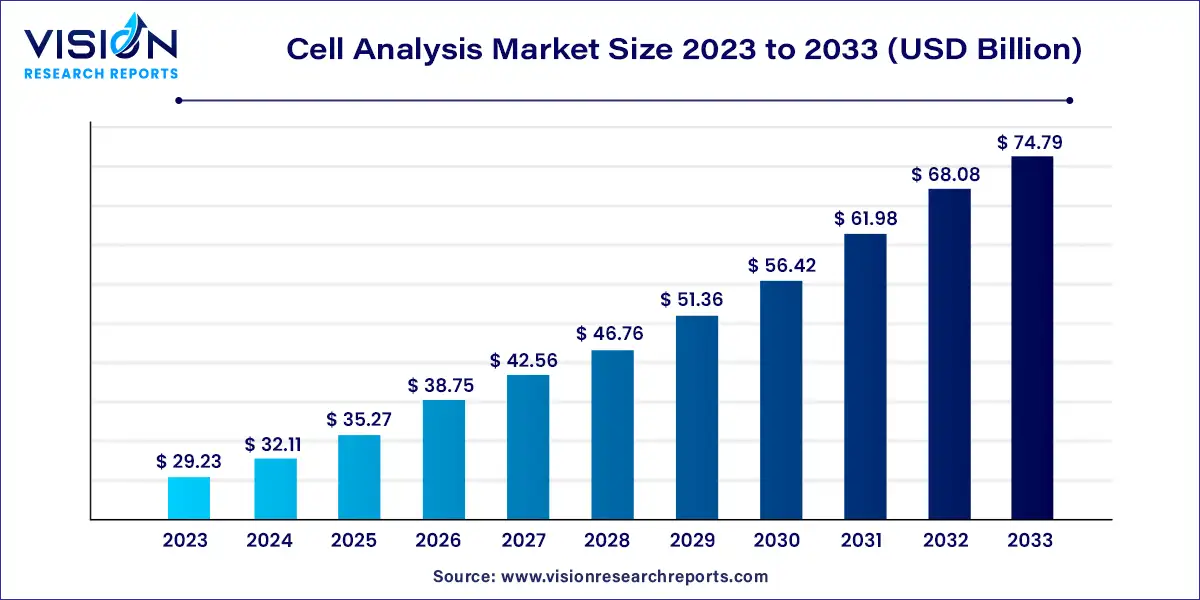
The global cell analysis market size was valued at USD 29.23 billion in 2023 and it is predicted to surpass around USD 74.79 billion by 2033 with a CAGR of 9.85% from 2024 to 2033. The cell analysis market has witnessed significant growth driven by advancements in biotechnology, genomics, and personalized medicine. This market encompasses a wide range of technologies and tools designed to analyze the structure, function, and behavior of cells.

The cell analysis market is experiencing substantial growth driven by the technological advancements in microscopy, flow cytometry, and molecular imaging have significantly enhanced the accuracy and efficiency of cellular analysis, expanding its applications across various fields such as cancer research, drug discovery, and personalized medicine. The increasing prevalence of chronic diseases, coupled with a growing demand for innovative diagnostic and therapeutic solutions, further propels market expansion. Moreover, the rise in biopharmaceutical research and development activities, alongside investments in genomic and proteomic studies, are fostering the adoption of advanced cell analysis technologies.
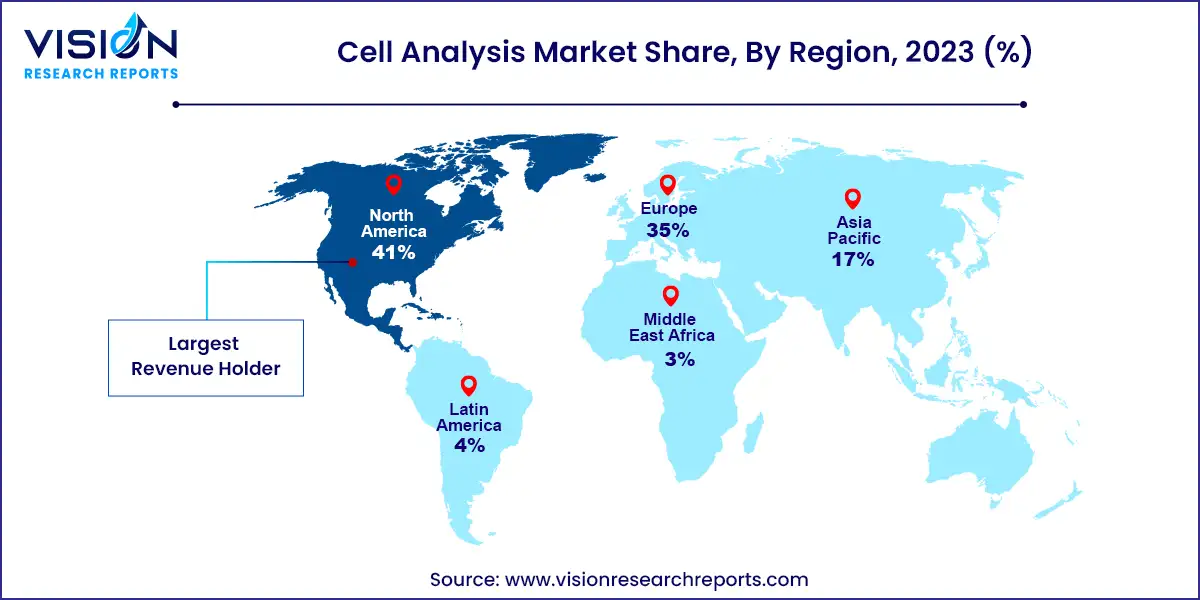
North America led the global market with a 41% share in 2023, supported by robust drug discovery activities, advanced technology adoption, and a high prevalence of chronic diseases. These factors drive the demand for effective treatment solutions, propelling market growth.
| Attribute | North America |
| Market Value | USD 11.98 Billion |
| Growth Rate | 9.83% CAGR |
| Projected Value | USD 30.66 Billion |
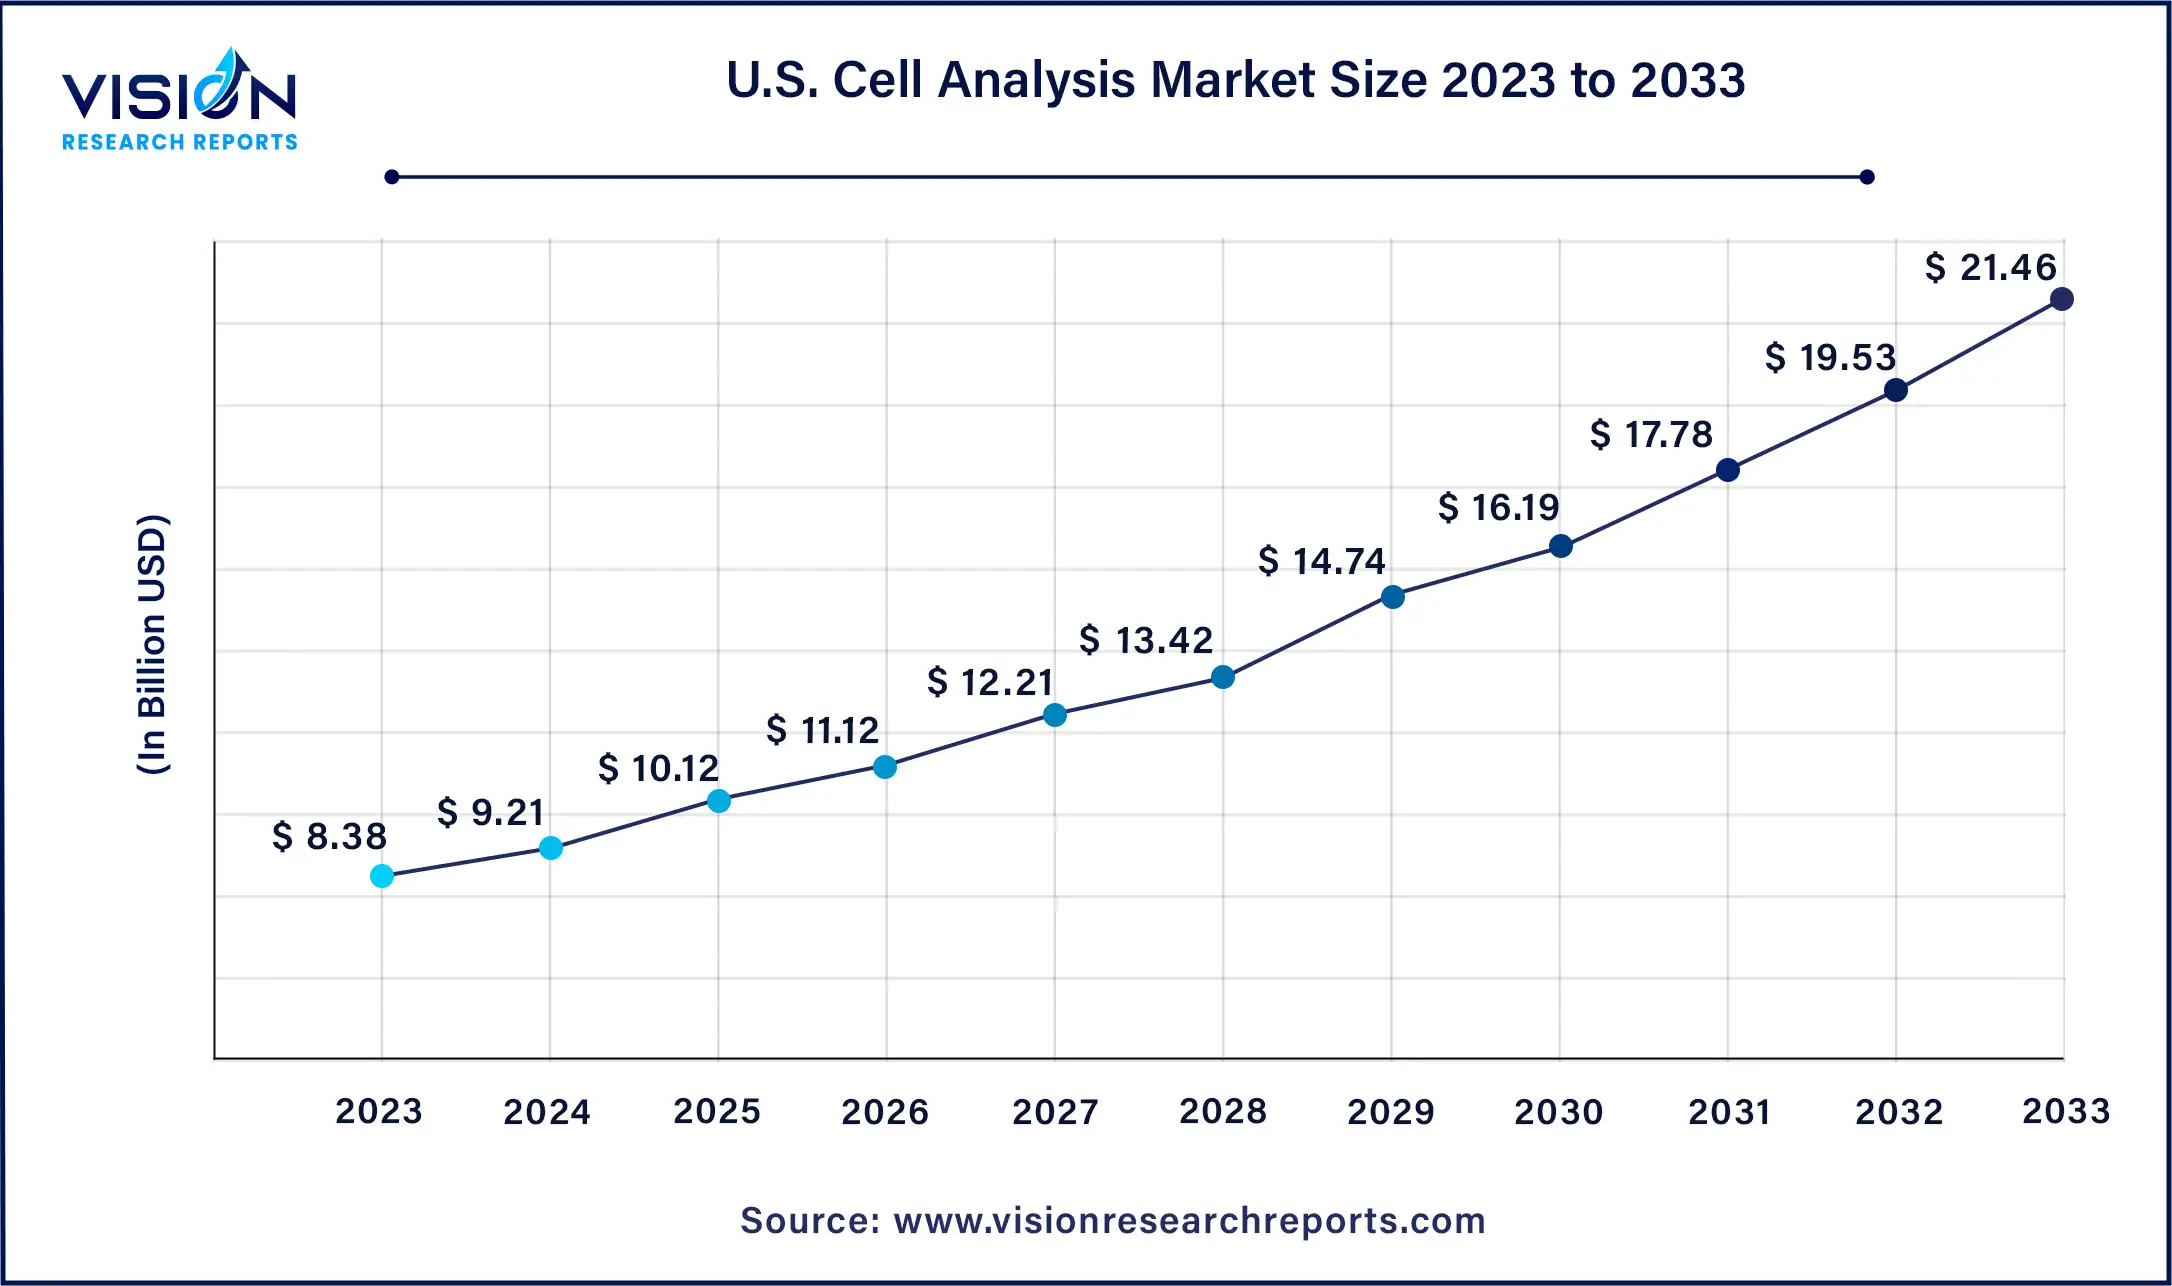
The U.S. cell analysis market size was estimated at around USD 8.38 billion in 2023 and it is projected to hit around USD 21.46 billion by 2033, growing at a CAGR of 9.83% from 2024 to 2033.

The U.S. cell analysis market is poised for substantial growth, driven by a favorable regulatory environment, significant R&D investments by key industry players, and technological advancements.
Europe's cell analysis market is set to expand significantly, supported by government initiatives, increased funding for life sciences, rising cancer prevalence, and advancements in healthcare infrastructure.

Asia Pacific is expected to witness the fastest market growth, driven by expanding healthcare investments, rising chronic disease prevalence, and increasing clinical trials, underscoring the region's growing demand for cell analysis technologies.
In 2023, the reagents & consumables segment led the market with a dominant revenue share of 49%. This segment's growth is attributed to its versatile applications across various experiments, frequent procurement needs, and high demand for assay kits. Unlike other cell analysis products, reagents & consumables cater to diverse research needs, ensuring consistent demand throughout the research process, thereby driving segmental growth.
The service segment is poised for rapid growth, driven by the increasing complexity of cell analysis techniques that require specialized expertise and solutions. This trend is further fueled by the outsourcing of specific services to Contract Research Organizations (CROs), offering researchers flexibility in accessing required capabilities.
Flow cytometry emerged as the leading technique in 2023, enabling researchers to analyze numerous cells simultaneously based on multiple parameters like size, shape, and molecular presence. Ongoing advancements in flow cytometry solutions, such as Sony Corporation's SFA - Life Sciences Cloud Platform, are enhancing its efficiency in identifying rare cells across diverse populations.
High-content screening is expected to grow the fastest, with a projected CAGR of 11.23%. Leveraging automated image analysis, AI, and machine learning, this technique provides deeper insights by simultaneously evaluating multiple cellular features and compound interactions.
Cell identification dominated the market with a substantial revenue share in 2023, serving as a foundational step in various downstream analyses. Its broad applicability in fields like immunology, oncology, and drug discovery, combined with a range of available identification techniques, contributes significantly to its market presence.
Single-cell analysis is anticipated to experience the highest growth rate, driven by its ability to uncover cellular heterogeneity crucial for understanding disease mechanisms and drug responses. Innovations such as PerkinElmer and Honeycomb Biotechnologies' HIVE scRNAseq Solution are advancing this segment by enabling comprehensive analysis of fragile cell types.
Pharmaceutical and biotechnology companies held the largest market share of 41% in 2023, driven by extensive drug discovery initiatives and investments in personalized medicine. These companies rely heavily on cell analysis for various research applications, consolidating their market position.
Hospitals and clinical testing laboratories are expected to grow rapidly, fueled by the increasing demand for biomarker identification and early disease diagnosis. Advanced cell analysis techniques enable precise disease profiling, facilitating personalized treatment strategies and improving patient outcomes.
By Product & Service
By Technique
By Process
By End-use
By Region
Chapter 1. Introduction
1.1. Research Objective
1.2. Scope of the Study
1.3. Definition
Chapter 2. Research Methodology
2.1. Research Approach
2.2. Data Sources
2.3. Assumptions & Limitations
Chapter 3. Executive Summary
3.1. Market Snapshot
Chapter 4. Market Variables and Scope
4.1. Introduction
4.2. Market Classification and Scope
4.3. Industry Value Chain Analysis
4.3.1. Raw Material Procurement Analysis
4.3.2. Sales and Distribution Channel Analysis
4.3.3. Downstream Buyer Analysis
Chapter 5. COVID 19 Impact on Cell Analysis Market
5.1. COVID-19 Landscape: Cell Analysis Industry Impact
5.2. COVID 19 - Impact Assessment for the Industry
5.3. COVID 19 Impact: Global Major Government Policy
5.4. Market Trends and Opportunities in the COVID-19 Landscape
Chapter 6. Market Dynamics Analysis and Trends
6.1. Market Dynamics
6.1.1. Market Drivers
6.1.2. Market Restraints
6.1.3. Market Opportunities
6.2. Porter’s Five Forces Analysis
6.2.1. Bargaining power of suppliers
6.2.2. Bargaining power of buyers
6.2.3. Threat of substitute
6.2.4. Threat of new entrants
6.2.5. Degree of competition
Chapter 7. Competitive Landscape
7.1.1. Company Market Share/Positioning Analysis
7.1.2. Key Strategies Adopted by Players
7.1.3. Vendor Landscape
7.1.3.1. List of Suppliers
7.1.3.2. List of Buyers
Chapter 8. Global Cell Analysis Market, By Product & Service
8.1. Cell Analysis Market, by Product & Service, 2024-2033
8.1.1. Reagents & Consumables
8.1.1.1. Market Revenue and Forecast (2021-2033)
8.1.2. Instruments
8.1.2.1. Market Revenue and Forecast (2021-2033)
8.1.3. Accessories
8.1.3.1. Market Revenue and Forecast (2021-2033)
8.1.4. Software
8.1.4.1. Market Revenue and Forecast (2021-2033)
8.1.5. Service
8.1.5.1. Market Revenue and Forecast (2021-2033)
Chapter 9. Global Cell Analysis Market, By Technique
9.1. Cell Analysis Market, by Technique, 2024-2033
9.1.1. Flow Cytometry
9.1.1.1. Market Revenue and Forecast (2021-2033)
9.1.2. PCR
9.1.2.1. Market Revenue and Forecast (2021-2033)
9.1.3. Cell Microarrays
9.1.3.1. Market Revenue and Forecast (2021-2033)
9.1.4. Microscopy
9.1.4.1. Market Revenue and Forecast (2021-2033)
9.1.5. Spectrophotometry
9.1.5.1. Market Revenue and Forecast (2021-2033)
9.1.6. High Content-Screening
9.1.6.1. Market Revenue and Forecast (2021-2033)
9.1.7. Other Techniques
9.1.7.1. Market Revenue and Forecast (2021-2033)
Chapter 10. Global Cell Analysis Market, By Process
10.1. Cell Analysis Market, by Process, 2024-2033
10.1.1. Cell Identification
10.1.1.1. Market Revenue and Forecast (2021-2033)
10.1.2. Cell Viability
10.1.2.1. Market Revenue and Forecast (2021-2033)
10.1.3. Cell Signaling Pathways
10.1.3.1. Market Revenue and Forecast (2021-2033)
10.1.4. Cell Proliferation
10.1.4.1. Market Revenue and Forecast (2021-2033)
10.1.5. Cell Counting
10.1.5.1. Market Revenue and Forecast (2021-2033)
10.1.6. Cell Interaction
10.1.6.1. Market Revenue and Forecast (2021-2033)
10.1.7. Cell Structure Study
10.1.7.1. Market Revenue and Forecast (2021-2033)
10.1.8. Single-cell Analysis
10.1.8.1. Market Revenue and Forecast (2021-2033)
10.1.9. Others
10.1.9.1. Market Revenue and Forecast (2021-2033)
Chapter 11. Global Cell Analysis Market, By End-use
11.1. Cell Analysis Market, by End-use, 2024-2033
11.1.1. Pharmaceutical & Biotechnology Companies
11.1.1.1. Market Revenue and Forecast (2021-2033)
11.1.2. Hospitals & Clinical Testing Laboratories
11.1.2.1. Market Revenue and Forecast (2021-2033)
11.1.3. Academic & Research Institutes
11.1.3.1. Market Revenue and Forecast (2021-2033)
11.1.4. Other
11.1.4.1. Market Revenue and Forecast (2021-2033)
Chapter 12. Global Cell Analysis Market, Regional Estimates and Trend Forecast
12.1. North America
12.1.1. Market Revenue and Forecast, by Product & Service (2021-2033)
12.1.2. Market Revenue and Forecast, by Technique (2021-2033)
12.1.3. Market Revenue and Forecast, by Process (2021-2033)
12.1.4. Market Revenue and Forecast, by End-use (2021-2033)
12.1.5. U.S.
12.1.5.1. Market Revenue and Forecast, by Product & Service (2021-2033)
12.1.5.2. Market Revenue and Forecast, by Technique (2021-2033)
12.1.5.3. Market Revenue and Forecast, by Process (2021-2033)
12.1.5.4. Market Revenue and Forecast, by End-use (2021-2033)
12.1.6. Rest of North America
12.1.6.1. Market Revenue and Forecast, by Product & Service (2021-2033)
12.1.6.2. Market Revenue and Forecast, by Technique (2021-2033)
12.1.6.3. Market Revenue and Forecast, by Process (2021-2033)
12.1.6.4. Market Revenue and Forecast, by End-use (2021-2033)
12.2. Europe
12.2.1. Market Revenue and Forecast, by Product & Service (2021-2033)
12.2.2. Market Revenue and Forecast, by Technique (2021-2033)
12.2.3. Market Revenue and Forecast, by Process (2021-2033)
12.2.4. Market Revenue and Forecast, by End-use (2021-2033)
12.2.5. UK
12.2.5.1. Market Revenue and Forecast, by Product & Service (2021-2033)
12.2.5.2. Market Revenue and Forecast, by Technique (2021-2033)
12.2.5.3. Market Revenue and Forecast, by Process (2021-2033)
12.2.5.4. Market Revenue and Forecast, by End-use (2021-2033)
12.2.6. Germany
12.2.6.1. Market Revenue and Forecast, by Product & Service (2021-2033)
12.2.6.2. Market Revenue and Forecast, by Technique (2021-2033)
12.2.6.3. Market Revenue and Forecast, by Process (2021-2033)
12.2.6.4. Market Revenue and Forecast, by End-use (2021-2033)
12.2.7. France
12.2.7.1. Market Revenue and Forecast, by Product & Service (2021-2033)
12.2.7.2. Market Revenue and Forecast, by Technique (2021-2033)
12.2.7.3. Market Revenue and Forecast, by Process (2021-2033)
12.2.7.4. Market Revenue and Forecast, by End-use (2021-2033)
12.2.8. Rest of Europe
12.2.8.1. Market Revenue and Forecast, by Product & Service (2021-2033)
12.2.8.2. Market Revenue and Forecast, by Technique (2021-2033)
12.2.8.3. Market Revenue and Forecast, by Process (2021-2033)
12.2.8.4. Market Revenue and Forecast, by End-use (2021-2033)
12.3. APAC
12.3.1. Market Revenue and Forecast, by Product & Service (2021-2033)
12.3.2. Market Revenue and Forecast, by Technique (2021-2033)
12.3.3. Market Revenue and Forecast, by Process (2021-2033)
12.3.4. Market Revenue and Forecast, by End-use (2021-2033)
12.3.5. India
12.3.5.1. Market Revenue and Forecast, by Product & Service (2021-2033)
12.3.5.2. Market Revenue and Forecast, by Technique (2021-2033)
12.3.5.3. Market Revenue and Forecast, by Process (2021-2033)
12.3.5.4. Market Revenue and Forecast, by End-use (2021-2033)
12.3.6. China
12.3.6.1. Market Revenue and Forecast, by Product & Service (2021-2033)
12.3.6.2. Market Revenue and Forecast, by Technique (2021-2033)
12.3.6.3. Market Revenue and Forecast, by Process (2021-2033)
12.3.6.4. Market Revenue and Forecast, by End-use (2021-2033)
12.3.7. Japan
12.3.7.1. Market Revenue and Forecast, by Product & Service (2021-2033)
12.3.7.2. Market Revenue and Forecast, by Technique (2021-2033)
12.3.7.3. Market Revenue and Forecast, by Process (2021-2033)
12.3.7.4. Market Revenue and Forecast, by End-use (2021-2033)
12.3.8. Rest of APAC
12.3.8.1. Market Revenue and Forecast, by Product & Service (2021-2033)
12.3.8.2. Market Revenue and Forecast, by Technique (2021-2033)
12.3.8.3. Market Revenue and Forecast, by Process (2021-2033)
12.3.8.4. Market Revenue and Forecast, by End-use (2021-2033)
12.4. MEA
12.4.1. Market Revenue and Forecast, by Product & Service (2021-2033)
12.4.2. Market Revenue and Forecast, by Technique (2021-2033)
12.4.3. Market Revenue and Forecast, by Process (2021-2033)
12.4.4. Market Revenue and Forecast, by End-use (2021-2033)
12.4.5. GCC
12.4.5.1. Market Revenue and Forecast, by Product & Service (2021-2033)
12.4.5.2. Market Revenue and Forecast, by Technique (2021-2033)
12.4.5.3. Market Revenue and Forecast, by Process (2021-2033)
12.4.5.4. Market Revenue and Forecast, by End-use (2021-2033)
12.4.6. North Africa
12.4.6.1. Market Revenue and Forecast, by Product & Service (2021-2033)
12.4.6.2. Market Revenue and Forecast, by Technique (2021-2033)
12.4.6.3. Market Revenue and Forecast, by Process (2021-2033)
12.4.6.4. Market Revenue and Forecast, by End-use (2021-2033)
12.4.7. South Africa
12.4.7.1. Market Revenue and Forecast, by Product & Service (2021-2033)
12.4.7.2. Market Revenue and Forecast, by Technique (2021-2033)
12.4.7.3. Market Revenue and Forecast, by Process (2021-2033)
12.4.7.4. Market Revenue and Forecast, by End-use (2021-2033)
12.4.8. Rest of MEA
12.4.8.1. Market Revenue and Forecast, by Product & Service (2021-2033)
12.4.8.2. Market Revenue and Forecast, by Technique (2021-2033)
12.4.8.3. Market Revenue and Forecast, by Process (2021-2033)
12.4.8.4. Market Revenue and Forecast, by End-use (2021-2033)
12.5. Latin America
12.5.1. Market Revenue and Forecast, by Product & Service (2021-2033)
12.5.2. Market Revenue and Forecast, by Technique (2021-2033)
12.5.3. Market Revenue and Forecast, by Process (2021-2033)
12.5.4. Market Revenue and Forecast, by End-use (2021-2033)
12.5.5. Brazil
12.5.5.1. Market Revenue and Forecast, by Product & Service (2021-2033)
12.5.5.2. Market Revenue and Forecast, by Technique (2021-2033)
12.5.5.3. Market Revenue and Forecast, by Process (2021-2033)
12.5.5.4. Market Revenue and Forecast, by End-use (2021-2033)
12.5.6. Rest of LATAM
12.5.6.1. Market Revenue and Forecast, by Product & Service (2021-2033)
12.5.6.2. Market Revenue and Forecast, by Technique (2021-2033)
12.5.6.3. Market Revenue and Forecast, by Process (2021-2033)
12.5.6.4. Market Revenue and Forecast, by End-use (2021-2033)
Chapter 13. Company Profiles
13.1. Thermo Fisher Scientific, Inc.
13.1.1. Company Overview
13.1.2. Product Offerings
13.1.3. Financial Performance
13.1.4. Recent Initiatives
13.2. Danaher
13.2.1. Company Overview
13.2.2. Product Offerings
13.2.3. Financial Performance
13.2.4. Recent Initiatives
13.3. BD
13.3.1. Company Overview
13.3.2. Product Offerings
13.3.3. Financial Performance
13.3.4. Recent Initiatives
13.4. Merck KGaA
13.4.1. Company Overview
13.4.2. Product Offerings
13.4.3. Financial Performance
13.4.4. Recent Initiatives
13.5. Agilent Technologies, Inc.
13.5.1. Company Overview
13.5.2. Product Offerings
13.5.3. Financial Performance
13.5.4. Recent Initiatives
13.6. Bio-Rad Laboratories, Inc.
13.6.1. Company Overview
13.6.2. Product Offerings
13.6.3. Financial Performance
13.6.4. Recent Initiatives
13.7. Miltenyl Biotech
13.7.1. Company Overview
13.7.2. Product Offerings
13.7.3. Financial Performance
13.7.4. Recent Initiatives
13.8. Revvity
13.8.1. Company Overview
13.8.2. Product Offerings
13.8.3. Financial Performance
13.8.4. Recent Initiatives
13.9. New England Biolabs
13.9.1. Company Overview
13.9.2. Product Offerings
13.9.3. Financial Performance
13.9.4. Recent Initiatives
13.10. Avantor, Inc.
13.10.1. Company Overview
13.10.2. Product Offerings
13.10.3. Financial Performance
13.10.4. Recent Initiatives
Chapter 14. Research Methodology
14.1. Primary Research
14.2. Secondary Research
14.3. Assumptions
Chapter 15. Appendix
15.1. About Us
15.2. Glossary of Terms
 Cross-segment Market Size and Analysis for
Mentioned Segments
 Additional Company Profiles (Upto 5 With No Cost)
 Additional Countries (Apart From Mentioned Countries)
 Country/Region-specific Report
 Go To Market Strategy
 Region Specific Market Dynamics
 Region Level Market Share
 Import Export Analysis
 Production Analysis
 Others