Chromatography Resin Market Size, Share, Growth, Trends | Report 2023-2032
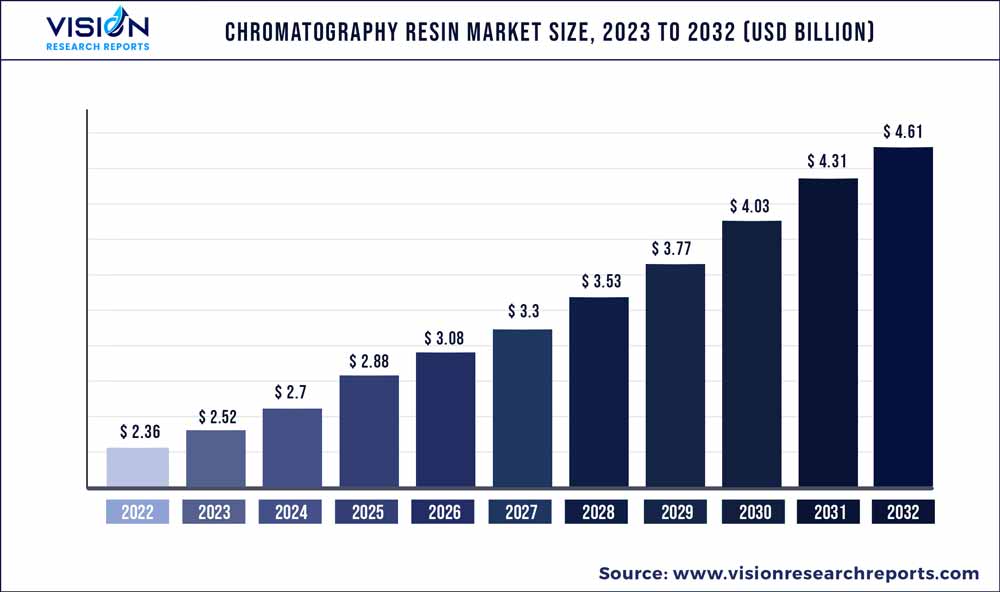
The global chromatography resin market was surpassed at USD 2.36 billion in 2022 and is expected to hit around USD 4.61 billion by 2032, growing at a CAGR of 6.92% from 2023 to 2032.
Key Pointers
Report Scope of the Chromatography Resin Market
| Report Coverage | Details |
| Market Size in 2022 | USD 2.36 billion |
| Revenue Forecast by 2032 | USD 4.61 billion |
| Growth rate from 2023 to 2032 | CAGR of 6.92% |
| Base Year | 2022 |
| Forecast Period | 2023 to 2032 |
| Market Analysis (Terms Used) | Value (US$ Million/Billion) or (Volume/Units) |
| Regions Covered | North America, Europe, Asia Pacific, Latin America, Middle East & Africa |
| Companies Covered | Merck KGaA ; Bio - Rad Laboratories; Inc.; Thermo Fisher Scientific; WIPRO GE HEALTHCARE PVT LTD; Purolite; GRACE; Mitsubishi Chemical Holdings Corporation; Danaher |
The growth is majorly driven by constantly increasing need for drug development activities for the production of biopharma and biological products for diagnostics.
Chromatography technique is used in therapeutic drug monitoring, which is used when a patient is on toxic medication to analyze the blood and urine levels. Tests such as blood, urine, stool, and umbilical cord on a regular basis are beneficial to ensure that the patient is taking an appropriate dose of medication. These technique helps companies develop and manufacture biological pharmaceutical tools to achieve safety and quality of active ingredients.
In North America, the pharmaceutical industry has been advancing for years and has grown at a faster rate, resulting in booming demand for ion exchange chromatography resin. Additionally, high healthcare spending and the presence of major pharmaceutical market leaders in the U.S. is the main driver of the chromatography resin market in the North America region.
Some of the key players operating in the industry are constantly undertaking initiatives to develop more effective and innovative products in an attempt to strengthen their position in the global market. In Covid-19 pandemic the chromatography resin manufacturers including Purolite, TriAltus Biosciences, and Avantor were majorly engaged in R&D activities for new product development. For instance, TriAltus Biosciences, a developer of innovative tools for protein purification developed novel CL7/Im7 system a protein purification technology. This technology was developed to aid the cancer institute for Covid-19 vaccine development.
Type Insights
Natural segment dominated the market with a revenue share of more than 51.03% in 2022. This high share is attributable to an increased consumption of naturally derived product, wide utilization in size chromatography, and paper chromatography in several industrial applications.
Natural resin consumption in North America is largely dominated by the U.S. on account of the presence of several global pharmaceutical giants. Expanding pharmaceutical and biomedical sectors because of the rise in healthcare expenditure and increasing demand from F&B sector are key drivers for the market in North America. Additionally, government allocation of funds in R&D of more productive chromatography resin is anticipated to further drive natural product demand in various applications and end uses in North America.
Furthermore, synthetic resin is segment is anticipated to grow at a faster pace owing to its growing utilization in ion exchange chromatography, which is used in F&B industry, chemicals, pharmaceuticals, petrochemicals, sugar production, water treatment, and softening of industrial water. Synthetic resin is increasingly being used instead of natural resin to increase production figures.
Technique Insights
Ion exchange technique segment dominated the market with a revenue share of over 42.02% in 2022. This high share is attributable to increasing emphasis on drug discovery processes by major pharmaceutical companies and CROs (contract research organization).
Synthetic resin is majorly used in ion exchange chromatography, which is used in F&B industry, chemicals, pharmaceuticals, sugar production, petrochemicals, water treatment, and softening of industrial water. Synthetic resin is increasingly used instead of natural resin to increase production figures.
Furthermore, affinity emerged as the second largest technique segment accounting for over 25% overall market share. The rise in the use of monoclonal antibodies, demand for protein purification and nucleic acid purification processes are the major factors responsible for propelling the affinity resin market.
End-use Insights
Pharmaceutical & biotechnology dominated the market with a revenue share of over 83.11% in 2022. Its high share is attributable to owing to high consumption of the resins in pharmaceutical processes to produce extremely pure materials in large quantity and to examine the purified compounds for contamination.
Moreover, growing use of monoclonal antibodies in critical therapeutic areas such as oncology, tuberculosis, and autoimmune diseases is likely to drive demand for chromatography resin. The increasing number of contract manufacturing organizations (CMOs) and contract research organizations (CROs) in the pharmaceutical sector is anticipated to drive the product demand.
Furthermore, the ion exchange technique is one of the most creative and active fields in the food and beverages industry, which also plays a vital role in the growth of the food industry. The food & beverages end use segment is anticipated to be the fastest growing end use segment owing to the increasing strict guidelines issued by food regulatory authorities all over the world.
Regional Insights
North America region dominated the market with a revenue share of more than 33.05% in 2022. This high share is attributed to the growing demand for drug discovery to control diseases all around the world such as Ebola, Zika, and others. Growing interest in the use of monoclonal antibodies in therapeutic areas is also expected to fuel the North America.
The U.S. is the major consumer of the product in North America accounting for more than 92% of the market in 2022. The country offers a premier scope for chromatography resin on account of its highly developed pharmaceutical industry and growing use in end-use applications, combined with the presence of a highly skilled workforce and growing R&D initiatives to encourage innovative product application.
Europe is home to major manufacturers such as Merck KGaA. The European Union’s initiatives such as the Innovative Medicines Initiative (IMI), which aims to speed up the development of better and safe medicines, have given a major boost to the chromatography resin demand in the region.
Germany is the biggest consumer of chromatography resin in Europe, owing to the significant presence of research and development facilities of global pharmaceutical companies. The region is increasingly exporting medicines and related products to neighboring countries as well as other economies around the world.
Major Asia Pacific countries including China, India, Japan, and others are expected to witness high economic growth over the forecast period. The growing government support to domestic manufacturing is likely to boost regional production levels and reduce the dependence on imports, which is expected to present lucrative opportunities for global manufacturers.
Chromatography Resin Market Segmentations:
By Type
By Technique
By End‑use
Chapter 1. Introduction
1.1. Research Objective
1.2. Scope of the Study
1.3. Definition
Chapter 2. Research Methodology
2.1. Research Approach
2.2. Data Sources
2.3. Assumptions & Limitations
Chapter 3. Executive Summary
3.1. Market Snapshot
Chapter 4. Market Variables and Scope
4.1. Introduction
4.2. Market Classification and Scope
4.3. Industry Value Chain Analysis
4.3.1. Raw Material Procurement Analysis
4.3.2. Sales and Distribution Type Analysis
4.3.3. Downstream Buyer Analysis
Chapter 5. COVID 19 Impact on Chromatography Resin Market
5.1. COVID-19 Landscape: Chromatography Resin Industry Impact
5.2. COVID 19 - Impact Assessment for the Industry
5.3. COVID 19 Impact: Global Major Government Policy
5.4. Market Trends and Opportunities in the COVID-19 Landscape
Chapter 6. Market Dynamics Analysis and Trends
6.1. Market Dynamics
6.1.1. Market Drivers
6.1.2. Market Restraints
6.1.3. Market Opportunities
6.2. Porter’s Five Forces Analysis
6.2.1. Bargaining power of suppliers
6.2.2. Bargaining power of buyers
6.2.3. Threat of substitute
6.2.4. Threat of new entrants
6.2.5. Degree of competition
Chapter 7. Competitive Landscape
7.1.1. Company Market Share/Positioning Analysis
7.1.2. Key Strategies Adopted by Players
7.1.3. Vendor Landscape
7.1.3.1. List of Suppliers
7.1.3.2. List of Buyers
Chapter 8. Global Chromatography Resin Market, By Type
8.1. Chromatography Resin Market, by Type, 2023-2032
8.1.1 Natural
8.1.1.1. Market Revenue and Forecast (2020-2032)
8.1.2. Synthetic
8.1.2.1. Market Revenue and Forecast (2020-2032)
8.1.3. Inorganic
8.1.3.1. Market Revenue and Forecast (2020-2032)
Chapter 9. Global Chromatography Resin Market, By Technique
9.1. Chromatography Resin Market, by Technique, 2023-2032
9.1.1. Ion Exchange
9.1.1.1. Market Revenue and Forecast (2020-2032)
9.1.2. Affinity
9.1.2.1. Market Revenue and Forecast (2020-2032)
9.1.3. Hydrophobic Interaction
9.1.3.1. Market Revenue and Forecast (2020-2032)
9.1.4. Size Exclusion
9.1.4.1. Market Revenue and Forecast (2020-2032)
9.1.5. Others
9.1.5.1. Market Revenue and Forecast (2020-2032)
Chapter 10. Global Chromatography Resin Market, By End‑use
10.1. Chromatography Resin Market, by End‑use, 2023-2032
10.1.1. Pharmaceutical & Biotechnology
10.1.1.1. Market Revenue and Forecast (2020-2032)
10.1.2. Food & Beverage
10.1.2.1. Market Revenue and Forecast (2020-2032)
Chapter 11. Global Chromatography Resin Market, Regional Estimates and Trend Forecast
11.1. North America
11.1.1. Market Revenue and Forecast, by Type (2020-2032)
11.1.2. Market Revenue and Forecast, by Technique (2020-2032)
11.1.3. Market Revenue and Forecast, by End‑use (2020-2032)
11.1.4. U.S.
11.1.4.1. Market Revenue and Forecast, by Type (2020-2032)
11.1.4.2. Market Revenue and Forecast, by Technique (2020-2032)
11.1.4.3. Market Revenue and Forecast, by End‑use (2020-2032)
11.1.5. Rest of North America
11.1.5.1. Market Revenue and Forecast, by Type (2020-2032)
11.1.5.2. Market Revenue and Forecast, by Technique (2020-2032)
11.1.5.3. Market Revenue and Forecast, by End‑use (2020-2032)
11.2. Europe
11.2.1. Market Revenue and Forecast, by Type (2020-2032)
11.2.2. Market Revenue and Forecast, by Technique (2020-2032)
11.2.3. Market Revenue and Forecast, by End‑use (2020-2032)
11.2.4. UK
11.2.4.1. Market Revenue and Forecast, by Type (2020-2032)
11.2.4.2. Market Revenue and Forecast, by Technique (2020-2032)
11.2.4.3. Market Revenue and Forecast, by End‑use (2020-2032)
11.2.5. Germany
11.2.5.1. Market Revenue and Forecast, by Type (2020-2032)
11.2.5.2. Market Revenue and Forecast, by Technique (2020-2032)
11.2.5.3. Market Revenue and Forecast, by End‑use (2020-2032)
11.2.6. France
11.2.6.1. Market Revenue and Forecast, by Type (2020-2032)
11.2.6.2. Market Revenue and Forecast, by Technique (2020-2032)
11.2.6.3. Market Revenue and Forecast, by End‑use (2020-2032)
11.2.7. Rest of Europe
11.2.7.1. Market Revenue and Forecast, by Type (2020-2032)
11.2.7.2. Market Revenue and Forecast, by Technique (2020-2032)
11.2.7.3. Market Revenue and Forecast, by End‑use (2020-2032)
11.3. APAC
11.3.1. Market Revenue and Forecast, by Type (2020-2032)
11.3.2. Market Revenue and Forecast, by Technique (2020-2032)
11.3.3. Market Revenue and Forecast, by End‑use (2020-2032)
11.3.4. India
11.3.4.1. Market Revenue and Forecast, by Type (2020-2032)
11.3.4.2. Market Revenue and Forecast, by Technique (2020-2032)
11.3.4.3. Market Revenue and Forecast, by End‑use (2020-2032)
11.3.5. China
11.3.5.1. Market Revenue and Forecast, by Type (2020-2032)
11.3.5.2. Market Revenue and Forecast, by Technique (2020-2032)
11.3.5.3. Market Revenue and Forecast, by End‑use (2020-2032)
11.3.6. Japan
11.3.6.1. Market Revenue and Forecast, by Type (2020-2032)
11.3.6.2. Market Revenue and Forecast, by Technique (2020-2032)
11.3.6.3. Market Revenue and Forecast, by End‑use (2020-2032)
11.3.7. Rest of APAC
11.3.7.1. Market Revenue and Forecast, by Type (2020-2032)
11.3.7.2. Market Revenue and Forecast, by Technique (2020-2032)
11.3.7.3. Market Revenue and Forecast, by End‑use (2020-2032)
11.4. MEA
11.4.1. Market Revenue and Forecast, by Type (2020-2032)
11.4.2. Market Revenue and Forecast, by Technique (2020-2032)
11.4.3. Market Revenue and Forecast, by End‑use (2020-2032)
11.4.4. GCC
11.4.4.1. Market Revenue and Forecast, by Type (2020-2032)
11.4.4.2. Market Revenue and Forecast, by Technique (2020-2032)
11.4.4.3. Market Revenue and Forecast, by End‑use (2020-2032)
11.4.5. North Africa
11.4.5.1. Market Revenue and Forecast, by Type (2020-2032)
11.4.5.2. Market Revenue and Forecast, by Technique (2020-2032)
11.4.5.3. Market Revenue and Forecast, by End‑use (2020-2032)
11.4.6. South Africa
11.4.6.1. Market Revenue and Forecast, by Type (2020-2032)
11.4.6.2. Market Revenue and Forecast, by Technique (2020-2032)
11.4.6.3. Market Revenue and Forecast, by End‑use (2020-2032)
11.4.7. Rest of MEA
11.4.7.1. Market Revenue and Forecast, by Type (2020-2032)
11.4.7.2. Market Revenue and Forecast, by Technique (2020-2032)
11.4.7.3. Market Revenue and Forecast, by End‑use (2020-2032)
11.5. Latin America
11.5.1. Market Revenue and Forecast, by Type (2020-2032)
11.5.2. Market Revenue and Forecast, by Technique (2020-2032)
11.5.3. Market Revenue and Forecast, by End‑use (2020-2032)
11.5.4. Brazil
11.5.4.1. Market Revenue and Forecast, by Type (2020-2032)
11.5.4.2. Market Revenue and Forecast, by Technique (2020-2032)
11.5.4.3. Market Revenue and Forecast, by End‑use (2020-2032)
11.5.5. Rest of LATAM
11.5.5.1. Market Revenue and Forecast, by Type (2020-2032)
11.5.5.2. Market Revenue and Forecast, by Technique (2020-2032)
11.5.5.3. Market Revenue and Forecast, by End‑use (2020-2032)
Chapter 12. Company Profiles
12.1. Merck KGaA
12.1.1. Company Overview
12.1.2. Product Offerings
12.1.3. Financial Performance
12.1.4. Recent Initiatives
12.2. Bio - Rad Laboratories; Inc.
12.2.1. Company Overview
12.2.2. Product Offerings
12.2.3. Financial Performance
12.2.4. Recent Initiatives
12.3. Thermo Fisher Scientific
12.3.1. Company Overview
12.3.2. Product Offerings
12.3.3. Financial Performance
12.3.4. Recent Initiatives
12.4. WIPRO GE HEALTHCARE PVT LTD
12.4.1. Company Overview
12.4.2. Product Offerings
12.4.3. Financial Performance
12.4.4. Recent Initiatives
12.5. Purolite
12.5.1. Company Overview
12.5.2. Product Offerings
12.5.3. Financial Performance
12.5.4. Recent Initiatives
12.6. GRACE
12.6.1. Company Overview
12.6.2. Product Offerings
12.6.3. Financial Performance
12.6.4. Recent Initiatives
12.7. Mitsubishi Chemical Holdings Corporation
12.7.1. Company Overview
12.7.2. Product Offerings
12.7.3. Financial Performance
12.7.4. Recent Initiatives
12.8. Danaher
12.8.1. Company Overview
12.8.2. Product Offerings
12.8.3. Financial Performance
12.8.4. Recent Initiatives
Chapter 13. Research Methodology
13.1. Primary Research
13.2. Secondary Research
13.3. Assumptions
Chapter 14. Appendix
14.1. About Us
14.2. Glossary of Terms
 Cross-segment Market Size and Analysis for
Mentioned Segments
Additional Company Profiles (Upto 5 With No Cost)
Additional Countries (Apart From Mentioned Countries)
Country/Region-specific Report
Go To Market Strategy
Region Specific Market DynamicsRegion Level Market Share Import Export AnalysisProduction AnalysisOthers
Cross-segment Market Size and Analysis for
Mentioned Segments
Additional Company Profiles (Upto 5 With No Cost)
Additional Countries (Apart From Mentioned Countries)
Country/Region-specific Report
Go To Market Strategy
Region Specific Market DynamicsRegion Level Market Share Import Export AnalysisProduction AnalysisOthers