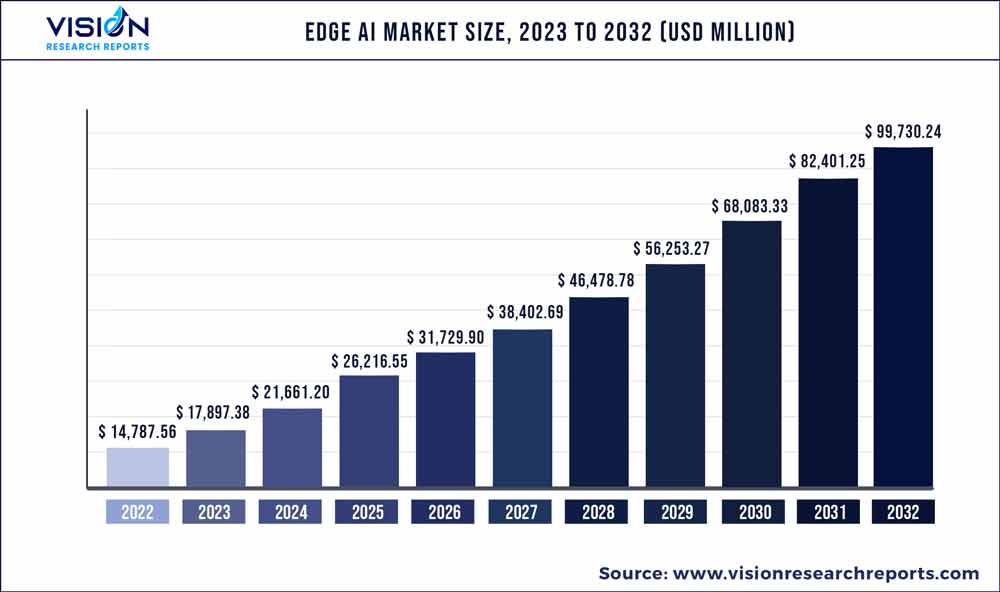
The global edge AI market was surpassed at USD 14,787.56 million in 2022 and is expected to hit around USD 99,730.24 million by 2032, growing at a CAGR of 21.03% from 2023 to 2032.
Key Pointers
Report Scope of the Edge AI Market
| Report Coverage | Details |
| Market Size in 2022 | USD 14,787.56 million |
| Revenue Forecast by 2032 | USD 99,730.24 million |
| Growth rate from 2023 to 2032 | CAGR of 21.03% |
| Base Year | 2022 |
| Forecast Period | 2023 to 2032 |
| Market Analysis (Terms Used) | Value (US$ Million/Billion) or (Volume/Units) |
| Regions Covered | North America, Europe, Asia Pacific, Latin America, Middle East & Africa |
| Companies Covered | ADLINK Technology Inc.; Alphabet Inc.; Amazon.com, Inc.; Gorilla Technology Group; Intel Corporation; International Business Machines Corporation; Microsoft Corporation; Nutanix, Inc.; Synaptics Incorporated, Viso.ai |
The growing use of edge AI applications such as smart AI vision, smart energy, AI healthcare, smart factory, and intelligent transportation systems is attributed to the market growth. For instance, in March 2022, Synaptics, a U.S.-based hardware company, released the Katana Edge AI Kit to speed up the development of sensor fusion applications and AI vision for the IoT. This kit integrates motion, vision, sound detection software, and hardware with wireless and wired connectivity to simplify the design and development of edge AI for the IoT.
Edge AI enables real-time data processing on IoT devices by ensuring high-performance data computation. The data required to apply AI in edge devices is stored on the device or a nearby server instead of in the cloud in the case of edge AI, which reduces computation latency and returns processed data quickly.
For instance, in March 2023, Minima Global Ltd, a Europe-based blockchain platform developer, collaborated with Inferrix Limited, a software company in the U.K., by combining Minima's blockchain technology with Inferrix's IoT edge and AI offerings. This partnership aims to develop unique IoT solutions by ensuring efficient and secure communication between all sensors and protecting mission-critical data.
Multi-Access Edge Computing architecture offers storage, computation, and networking capabilities at the network's edge, close to end-users and end devices. In MEC Edge AI use cases, virtual devices are used rather than physical edge computers to process camera video streams over a 5G connection.
For instance, in February 2023, Cellnex Ireland, an operator of wireless telecom infrastructure in Europe, and Dublin City University in Europe collaborated to create a 5G-enabled smart campus. Through this partnership, Cellnex installs a variety of telecommunication infrastructure to ensure 5G coverage across the main campus and to enable Mobile Edge Computing (MEC) capabilities on the campuses.
The use of artificial intelligence applications, including virtual diagnostics, robotics-assisted surgery, image analysis, and electroceuticals in the healthcare sector, is rapidly increasing because of the accurate output results provided by such solutions. Moreover, edge-based cybersecurity is used to protect sensitive health data.
For instance, in September 2022, Nvidia Corporation, a U.S.-based software company, released the Nvidia IGX platform to expand edge AI tech for robotics and healthcare. This platform includes an AI-optimized computing system and device for edge AI in robotics. This initiative aimed to bring robotics to healthcare by combining imaging sensors with real-time, deep-learning computer vision.
Key Companies & Market Share Insights
The market is characterized by strong competition, with a few major worldwide competitors owning a significant market share. The major focus is on developing new products and collaboration among the key players. For instance, in May 2021, STMicroelectronics, a European semiconductor manufacturing company, acquired Cartesiam, a software company in France. Through this acquisition, STMicroelectronics strengthened its technology portfolio and reinforced its AI strategy with the help of Cartesiam. Some prominent players in the global edge AI market include:
Edge AI Market Segmentations:
| By Component | By End-use Industry |
|
Hardware Software Edge Cloud Infrastructure Services |
Consumer Electronics Smart Cities Manufacturing Automotive Government Healthcare IT & Telecom Energy Retail Others |
Chapter 1. Introduction
1.1. Research Objective
1.2. Scope of the Study
1.3. Definition
Chapter 2. Research Methodology
2.1. Research Approach
2.2. Data Sources
2.3. Assumptions & Limitations
Chapter 3. Executive Summary
3.1. Market Snapshot
Chapter 4. Market Variables and Scope
4.1. Introduction
4.2. Market Classification and Scope
4.3. Industry Value Chain Analysis
4.3.1. Raw Material Procurement Analysis
4.3.2. Sales and Distribution Channel Analysis
4.3.3. Downstream Buyer Analysis
Chapter 5. COVID 19 Impact on Edge AI Market
5.1. COVID-19 Landscape: Edge AI Industry Impact
5.2. COVID 19 - Impact Assessment for the Industry
5.3. COVID 19 Impact: Global Major Government Policy
5.4. Market Trends and Opportunities in the COVID-19 Landscape
Chapter 6. Market Dynamics Analysis and Trends
6.1. Market Dynamics
6.1.1. Market Drivers
6.1.2. Market Restraints
6.1.3. Market Opportunities
6.2. Porter’s Five Forces Analysis
6.2.1. Bargaining power of suppliers
6.2.2. Bargaining power of buyers
6.2.3. Threat of substitute
6.2.4. Threat of new entrants
6.2.5. Degree of competition
Chapter 7. Competitive Landscape
7.1.1. Company Market Share/Positioning Analysis
7.1.2. Key Strategies Adopted by Players
7.1.3. Vendor Landscape
7.1.3.1. List of Suppliers
7.1.3.2. List of Buyers
Chapter 8. Global Edge AI Market, By Component
8.1. Edge AI Market, by Component, 2023-2032
8.1.1. Hardware
8.1.1.1. Market Revenue and Forecast (2020-2032)
8.1.2. Software
8.1.2.1. Market Revenue and Forecast (2020-2032)
8.1.3. Edge Cloud Infrastructure
8.1.3.1. Market Revenue and Forecast (2020-2032)
8.1.4. Services
8.1.4.1. Market Revenue and Forecast (2020-2032)
Chapter 9. Global Edge AI Market, By End-use Industry
9.1. Edge AI Market, by End-use Industry, 2023-2032
9.1.1. Consumer Electronics
9.1.1.1. Market Revenue and Forecast (2020-2032)
9.1.2. Smart Cities
9.1.2.1. Market Revenue and Forecast (2020-2032)
9.1.3. Manufacturing
9.1.3.1. Market Revenue and Forecast (2020-2032)
9.1.4. Automotive
9.1.4.1. Market Revenue and Forecast (2020-2032)
9.1.5. Government
9.1.5.1. Market Revenue and Forecast (2020-2032)
9.1.6. Healthcare
9.1.6.1. Market Revenue and Forecast (2020-2032)
9.1.7. IT & Telecom
9.1.7.1. Market Revenue and Forecast (2020-2032)
9.1.8. Energy
9.1.8.1. Market Revenue and Forecast (2020-2032)
9.1.9. Retail
9.1.9.1. Market Revenue and Forecast (2020-2032)
9.1.10. Others
9.1.10.1. Market Revenue and Forecast (2020-2032)
Chapter 10. Global Edge AI Market, Regional Estimates and Trend Forecast
10.1. North America
10.1.1. Market Revenue and Forecast, by Component (2020-2032)
10.1.2. Market Revenue and Forecast, by End-use Industry (2020-2032)
10.1.3. U.S.
10.1.3.1. Market Revenue and Forecast, by Component (2020-2032)
10.1.3.2. Market Revenue and Forecast, by End-use Industry (2020-2032)
10.1.4. Rest of North America
10.1.4.1. Market Revenue and Forecast, by Component (2020-2032)
10.1.4.2. Market Revenue and Forecast, by End-use Industry (2020-2032)
10.2. Europe
10.2.1. Market Revenue and Forecast, by Component (2020-2032)
10.2.2. Market Revenue and Forecast, by End-use Industry (2020-2032)
10.2.3. UK
10.2.3.1. Market Revenue and Forecast, by Component (2020-2032)
10.2.3.2. Market Revenue and Forecast, by End-use Industry (2020-2032)
10.2.4. Germany
10.2.4.1. Market Revenue and Forecast, by Component (2020-2032)
10.2.4.2. Market Revenue and Forecast, by End-use Industry (2020-2032)
10.2.5. France
10.2.5.1. Market Revenue and Forecast, by Component (2020-2032)
10.2.5.2. Market Revenue and Forecast, by End-use Industry (2020-2032)
10.2.6. Rest of Europe
10.2.6.1. Market Revenue and Forecast, by Component (2020-2032)
10.2.6.2. Market Revenue and Forecast, by End-use Industry (2020-2032)
10.3. APAC
10.3.1. Market Revenue and Forecast, by Component (2020-2032)
10.3.2. Market Revenue and Forecast, by End-use Industry (2020-2032)
10.3.3. India
10.3.3.1. Market Revenue and Forecast, by Component (2020-2032)
10.3.3.2. Market Revenue and Forecast, by End-use Industry (2020-2032)
10.3.4. China
10.3.4.1. Market Revenue and Forecast, by Component (2020-2032)
10.3.4.2. Market Revenue and Forecast, by End-use Industry (2020-2032)
10.3.5. Japan
10.3.5.1. Market Revenue and Forecast, by Component (2020-2032)
10.3.5.2. Market Revenue and Forecast, by End-use Industry (2020-2032)
10.3.6. Rest of APAC
10.3.6.1. Market Revenue and Forecast, by Component (2020-2032)
10.3.6.2. Market Revenue and Forecast, by End-use Industry (2020-2032)
10.4. MEA
10.4.1. Market Revenue and Forecast, by Component (2020-2032)
10.4.2. Market Revenue and Forecast, by End-use Industry (2020-2032)
10.4.3. GCC
10.4.3.1. Market Revenue and Forecast, by Component (2020-2032)
10.4.3.2. Market Revenue and Forecast, by End-use Industry (2020-2032)
10.4.4. North Africa
10.4.4.1. Market Revenue and Forecast, by Component (2020-2032)
10.4.4.2. Market Revenue and Forecast, by End-use Industry (2020-2032)
10.4.5. South Africa
10.4.5.1. Market Revenue and Forecast, by Component (2020-2032)
10.4.5.2. Market Revenue and Forecast, by End-use Industry (2020-2032)
10.4.6. Rest of MEA
10.4.6.1. Market Revenue and Forecast, by Component (2020-2032)
10.4.6.2. Market Revenue and Forecast, by End-use Industry (2020-2032)
10.5. Latin America
10.5.1. Market Revenue and Forecast, by Component (2020-2032)
10.5.2. Market Revenue and Forecast, by End-use Industry (2020-2032)
10.5.3. Brazil
10.5.3.1. Market Revenue and Forecast, by Component (2020-2032)
10.5.3.2. Market Revenue and Forecast, by End-use Industry (2020-2032)
10.5.4. Rest of LATAM
10.5.4.1. Market Revenue and Forecast, by Component (2020-2032)
10.5.4.2. Market Revenue and Forecast, by End-use Industry (2020-2032)
Chapter 11. Company Profiles
11.1. ADLINK Technology Inc.
11.1.1. Company Overview
11.1.2. Product Offerings
11.1.3. Financial Performance
11.1.4. Recent Initiatives
11.2. Alphabet Inc.
11.2.1. Company Overview
11.2.2. Product Offerings
11.2.3. Financial Performance
11.2.4. Recent Initiatives
11.3. Amazon.com, Inc
11.3.1. Company Overview
11.3.2. Product Offerings
11.3.3. Financial Performance
11.3.4. Recent Initiatives
11.4. Gorilla Technology Group
11.4.1. Company Overview
11.4.2. Product Offerings
11.4.3. Financial Performance
11.4.4. LTE Scientific
11.5. Intel Corporation
11.5.1. Company Overview
11.5.2. Product Offerings
11.5.3. Financial Performance
11.5.4. Recent Initiatives
11.6. International Business Machines Corporation
11.6.1. Company Overview
11.6.2. Product Offerings
11.6.3. Financial Performance
11.6.4. Recent Initiatives
11.7. Microsoft Corporation
11.7.1. Company Overview
11.7.2. Product Offerings
11.7.3. Financial Performance
11.7.4. Recent Initiatives
11.8. Nutanix, Inc.
11.8.1. Company Overview
11.8.2. Product Offerings
11.8.3. Financial Performance
11.8.4. Recent Initiatives
11.9. Synaptics Incorporated
11.9.1. Company Overview
11.9.2. Product Offerings
11.9.3. Financial Performance
11.9.4. Recent Initiatives
11.10. Viso.ai
11.10.1. Company Overview
11.10.2. Product Offerings
11.10.3. Financial Performance
11.10.4. Recent Initiatives
Chapter 12. Research Methodology
12.1. Primary Research
12.2. Secondary Research
12.3. Assumptions
Chapter 13. Appendix
13.1. About Us
13.2. Glossary of Terms
 Cross-segment Market Size and Analysis for
Mentioned Segments
Additional Company Profiles (Upto 5 With No Cost)
Additional Countries (Apart From Mentioned Countries)
Country/Region-specific Report
Go To Market Strategy
Region Specific Market DynamicsRegion Level Market Share Import Export AnalysisProduction AnalysisOthers
Cross-segment Market Size and Analysis for
Mentioned Segments
Additional Company Profiles (Upto 5 With No Cost)
Additional Countries (Apart From Mentioned Countries)
Country/Region-specific Report
Go To Market Strategy
Region Specific Market DynamicsRegion Level Market Share Import Export AnalysisProduction AnalysisOthers