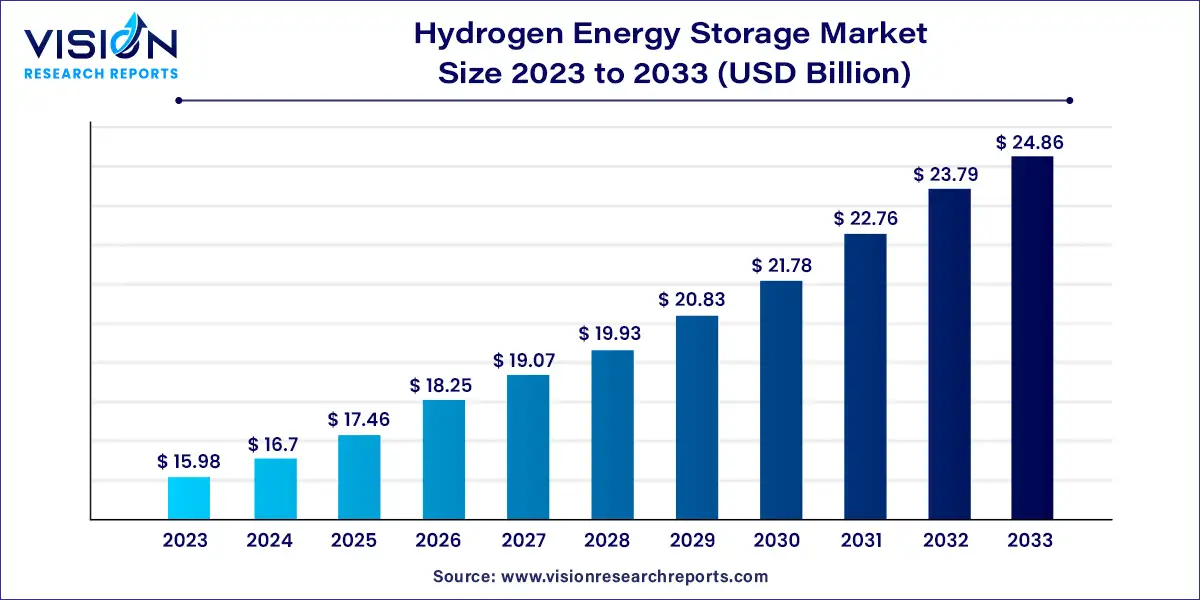
The global hydrogen energy storage market size was valued at USD 15.98 billion in 2023 and it is predicted to surpass around USD 24.86 billion by 2033 with a CAGR of 4.52% from 2024 to 2033. Hydrogen energy storage is emerging as a crucial technology in the transition to renewable energy. It involves the conversion of electricity into hydrogen gas, which can be stored and later converted back into electricity or used as fuel. This method is gaining traction due to its ability to store large amounts of energy for extended periods, making it an ideal solution for balancing supply and demand in renewable energy systems.

The hydrogen energy storage market is experiencing robust growth due to an increasing integration of renewable energy sources, such as wind and solar, necessitates efficient energy storage solutions to address the intermittency of these sources. Hydrogen energy storage provides a versatile and scalable solution, allowing surplus renewable energy to be stored and utilized when demand exceeds supply. Secondly, global efforts to reduce carbon emissions are driving the adoption of hydrogen as a clean energy carrier. Hydrogen, when produced from renewable sources, offers a zero-emission alternative to fossil fuels, aligning with international climate goals and decarbonization strategies. Technological advancements in hydrogen production, such as electrolysis and improved storage methods, are further accelerating market growth by enhancing the efficiency and cost-effectiveness of hydrogen systems. Additionally, supportive government policies and substantial investments in hydrogen infrastructure are creating a favorable environment for market expansion.
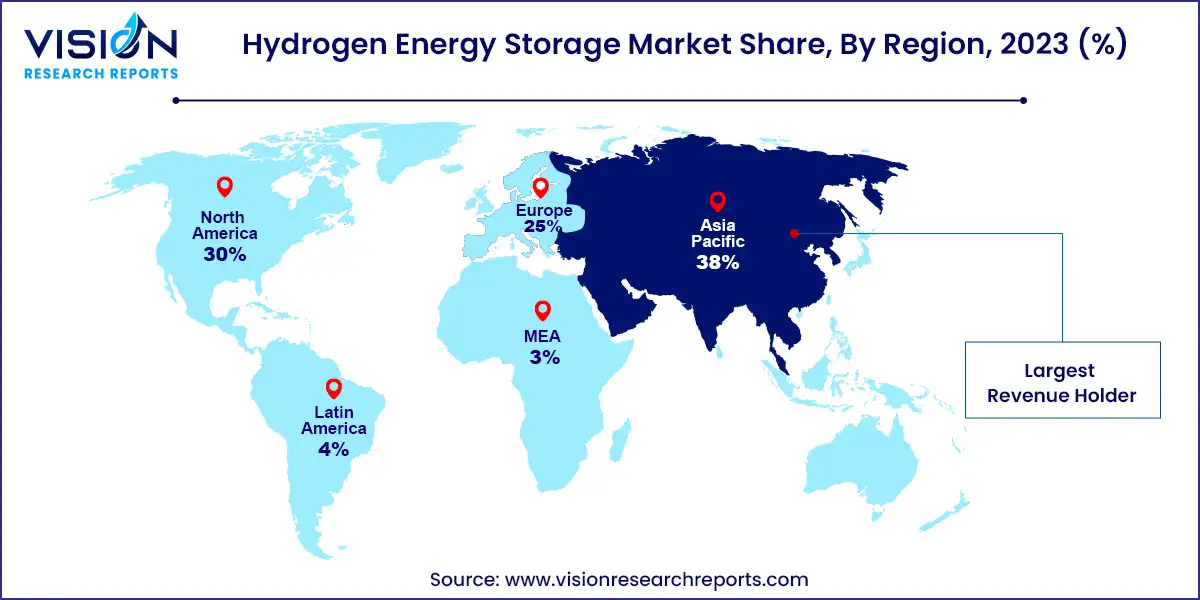
The Asia Pacific region commanded the largest revenue share of over 38% in 2023. This market includes major countries like China, Japan, South Korea, India, Australia, and other Southeast Asian nations. In Europe, key countries such as Russia, Spain, Germany, Italy, and the UK, along with smaller Eastern and Central European nations, contribute significantly to the hydrogen energy storage industry.

Large-scale hydrogen energy storage projects are expanding across Europe, boosting market demand. For example, Orsted, a Danish company, plans to use surplus wind farm electricity from the North Sea to produce renewable hydrogen through electrolysis, which will be sold to large commercial consumers. In North America, the market is expected to grow rapidly due to stringent pollution control regulations, increased use of cleaner fuels, and the rising application of fuel cells.
In 2023, the compression storage technology segment dominated the market, accounting for over 41% of the revenue. This prominence is due to the extensive use of compressed hydrogen across various sectors. Compressed hydrogen is widely utilized for on-site stationary power generation, hydrogen refueling stations, and as fuel for road transportation vehicles with fuel cells. Additionally, this technology is employed to store hydrogen in cylinders for industrial applications within manufacturing and chemical industries.
Bulk industrial gas suppliers, including Linde, Air Liquide, and Air Products & Chemicals Inc., favor liquefaction technology for delivering hydrogen in large quantities to industrial end-users such as those in the oil and gas and chemical industries. Liquefaction is essential for these users who require substantial amounts of hydrogen for their processes. Looking ahead, the material-based storage technology segment is anticipated to grow significantly. This segment includes hydride storage systems, liquid hydrogen carriers, and surface storage systems, all known for their high volumetric storage density compared to other technologies.
The solid storage segment represented the largest revenue share of approximately 51% in 2023. Storing hydrogen in solid form, where it is embedded in another material, is emerging as a notable area in the market. Techniques for solid hydrogen storage include absorption or adsorption mechanisms by materials.
Currently, liquid hydrogen storage is reserved for specialized applications, such as space travel and bulk industrial storage. For instance, tanks on the Ariane launcher, developed by Air Liquide, store 28 tons of liquid hydrogen to fuel the central engine.
In 2023, the industrial application segment led the market with a revenue share exceeding 41%. Hydrogen energy storage for residential use remains limited globally. However, countries like Japan, Germany, France, and Belgium are enhancing their legislative frameworks, which are expected to boost the use of fuel cells for residential micro combined heat and power systems. For example, Japan’s ENE-FARM program has promoted the adoption of fuel cell-based micro-cogeneration systems in the residential sector.
The commercial application segment encompasses hydrogen refueling stations and micro-CHP fuel cell installations. The number of hydrogen refueling stations worldwide has more than doubled in the past five years, increasing from 181 in 2014 to over 540 in 2020. This growth is primarily driven by developments in Europe and Asia.
By Technology
By Physical State
By Application
By Region
Chapter 1. Introduction
1.1. Research Objective
1.2. Scope of the Study
1.3. Definition
Chapter 2. Research Methodology
2.1. Research Approach
2.2. Data Sources
2.3. Assumptions & Limitations
Chapter 3. Executive Summary
3.1. Market Snapshot
Chapter 4. Market Variables and Scope
4.1. Introduction
4.2. Market Classification and Scope
4.3. Industry Value Chain Analysis
4.3.1. Raw Material Procurement Analysis
4.3.2. Sales and Distribution Channel Analysis
4.3.3. Downstream Buyer Analysis
Chapter 5. COVID 19 Impact on Hydrogen Energy Storage Market
5.1. COVID-19 Landscape: Hydrogen Energy Storage Industry Impact
5.2. COVID 19 - Impact Assessment for the Industry
5.3. COVID 19 Impact: Global Major Government Policy
5.4. Market Trends and Opportunities in the COVID-19 Landscape
Chapter 6. Market Dynamics Analysis and Trends
6.1. Market Dynamics
6.1.1. Market Drivers
6.1.2. Market Restraints
6.1.3. Market Opportunities
6.2. Porter’s Five Forces Analysis
6.2.1. Bargaining power of suppliers
6.2.2. Bargaining power of buyers
6.2.3. Threat of substitute
6.2.4. Threat of new entrants
6.2.5. Degree of competition
Chapter 7. Competitive Landscape
7.1.1. Company Market Share/Positioning Analysis
7.1.2. Key Strategies Adopted by Players
7.1.3. Vendor Landscape
7.1.3.1. List of Suppliers
7.1.3.2. List of Buyers
Chapter 8. Global Hydrogen Energy Storage Market, By Technology
8.1. Hydrogen Energy Storage Market, by Technology, 2024-2033
8.1.1 Compression
8.1.1.1. Market Revenue and Forecast (2021-2033)
8.1.2. Liquefaction
8.1.2.1. Market Revenue and Forecast (2021-2033)
8.1.3. Material Based
8.1.3.1. Market Revenue and Forecast (2021-2033)
Chapter 9. Global Hydrogen Energy Storage Market, By Physical State
9.1. Hydrogen Energy Storage Market, by Physical State, 2024-2033
9.1.1. Solid
9.1.1.1. Market Revenue and Forecast (2021-2033)
9.1.2. Liquid
9.1.2.1. Market Revenue and Forecast (2021-2033)
9.1.3. Gas
9.1.3.1. Market Revenue and Forecast (2021-2033)
Chapter 10. Global Hydrogen Energy Storage Market, By Application
10.1. Hydrogen Energy Storage Market, by Application, 2024-2033
10.1.1. Residential
10.1.1.1. Market Revenue and Forecast (2021-2033)
10.1.2. Commercial
10.1.2.1. Market Revenue and Forecast (2021-2033)
10.1.3. Industrial
10.1.3.1. Market Revenue and Forecast (2021-2033)
10.1.4. Cheese
Chapter 11. Global Hydrogen Energy Storage Market, Regional Estimates and Trend Forecast
11.1. North America
11.1.1. Market Revenue and Forecast, by Technology (2021-2033)
11.1.2. Market Revenue and Forecast, by Physical State (2021-2033)
11.1.3. Market Revenue and Forecast, by Application (2021-2033)
11.1.4. U.S.
11.1.4.1. Market Revenue and Forecast, by Technology (2021-2033)
11.1.4.2. Market Revenue and Forecast, by Physical State (2021-2033)
11.1.4.3. Market Revenue and Forecast, by Application (2021-2033)
11.1.5. Rest of North America
11.1.5.1. Market Revenue and Forecast, by Technology (2021-2033)
11.1.5.2. Market Revenue and Forecast, by Physical State (2021-2033)
11.1.5.3. Market Revenue and Forecast, by Application (2021-2033)
11.2. Europe
11.2.1. Market Revenue and Forecast, by Technology (2021-2033)
11.2.2. Market Revenue and Forecast, by Physical State (2021-2033)
11.2.3. Market Revenue and Forecast, by Application (2021-2033)
11.2.4. UK
11.2.4.1. Market Revenue and Forecast, by Technology (2021-2033)
11.2.4.2. Market Revenue and Forecast, by Physical State (2021-2033)
11.2.4.3. Market Revenue and Forecast, by Application (2021-2033)
11.2.5. Germany
11.2.5.1. Market Revenue and Forecast, by Technology (2021-2033)
11.2.5.2. Market Revenue and Forecast, by Physical State (2021-2033)
11.2.5.3. Market Revenue and Forecast, by Application (2021-2033)
11.2.6. France
11.2.6.1. Market Revenue and Forecast, by Technology (2021-2033)
11.2.6.2. Market Revenue and Forecast, by Physical State (2021-2033)
11.2.6.3. Market Revenue and Forecast, by Application (2021-2033)
11.2.7. Rest of Europe
11.2.7.1. Market Revenue and Forecast, by Technology (2021-2033)
11.2.7.2. Market Revenue and Forecast, by Physical State (2021-2033)
11.2.7.3. Market Revenue and Forecast, by Application (2021-2033)
11.3. APAC
11.3.1. Market Revenue and Forecast, by Technology (2021-2033)
11.3.2. Market Revenue and Forecast, by Physical State (2021-2033)
11.3.3. Market Revenue and Forecast, by Application (2021-2033)
11.3.4. India
11.3.4.1. Market Revenue and Forecast, by Technology (2021-2033)
11.3.4.2. Market Revenue and Forecast, by Physical State (2021-2033)
11.3.4.3. Market Revenue and Forecast, by Application (2021-2033)
11.3.5. China
11.3.5.1. Market Revenue and Forecast, by Technology (2021-2033)
11.3.5.2. Market Revenue and Forecast, by Physical State (2021-2033)
11.3.5.3. Market Revenue and Forecast, by Application (2021-2033)
11.3.6. Japan
11.3.6.1. Market Revenue and Forecast, by Technology (2021-2033)
11.3.6.2. Market Revenue and Forecast, by Physical State (2021-2033)
11.3.6.3. Market Revenue and Forecast, by Application (2021-2033)
11.3.7. Rest of APAC
11.3.7.1. Market Revenue and Forecast, by Technology (2021-2033)
11.3.7.2. Market Revenue and Forecast, by Physical State (2021-2033)
11.3.7.3. Market Revenue and Forecast, by Application (2021-2033)
11.4. MEA
11.4.1. Market Revenue and Forecast, by Technology (2021-2033)
11.4.2. Market Revenue and Forecast, by Physical State (2021-2033)
11.4.3. Market Revenue and Forecast, by Application (2021-2033)
11.4.4. GCC
11.4.4.1. Market Revenue and Forecast, by Technology (2021-2033)
11.4.4.2. Market Revenue and Forecast, by Physical State (2021-2033)
11.4.4.3. Market Revenue and Forecast, by Application (2021-2033)
11.4.5. North Africa
11.4.5.1. Market Revenue and Forecast, by Technology (2021-2033)
11.4.5.2. Market Revenue and Forecast, by Physical State (2021-2033)
11.4.5.3. Market Revenue and Forecast, by Application (2021-2033)
11.4.6. South Africa
11.4.6.1. Market Revenue and Forecast, by Technology (2021-2033)
11.4.6.2. Market Revenue and Forecast, by Physical State (2021-2033)
11.4.6.3. Market Revenue and Forecast, by Application (2021-2033)
11.4.7. Rest of MEA
11.4.7.1. Market Revenue and Forecast, by Technology (2021-2033)
11.4.7.2. Market Revenue and Forecast, by Physical State (2021-2033)
11.4.7.3. Market Revenue and Forecast, by Application (2021-2033)
11.5. Latin America
11.5.1. Market Revenue and Forecast, by Technology (2021-2033)
11.5.2. Market Revenue and Forecast, by Physical State (2021-2033)
11.5.3. Market Revenue and Forecast, by Application (2021-2033)
11.5.4. Brazil
11.5.4.1. Market Revenue and Forecast, by Technology (2021-2033)
11.5.4.2. Market Revenue and Forecast, by Physical State (2021-2033)
11.5.4.3. Market Revenue and Forecast, by Application (2021-2033)
11.5.5. Rest of LATAM
11.5.5.1. Market Revenue and Forecast, by Technology (2021-2033)
11.5.5.2. Market Revenue and Forecast, by Physical State (2021-2033)
11.5.5.3. Market Revenue and Forecast, by Application (2021-2033)
Chapter 12. Company Profiles
12.1. Air Liquide
12.1.1. Company Overview
12.1.2. Product Offerings
12.1.3. Financial Performance
12.1.4. Recent Initiatives
12.2. Air Products Inc.
12.2.1. Company Overview
12.2.2. Product Offerings
12.2.3. Financial Performance
12.2.4. Recent Initiatives
12.3. Cummins Inc.
12.3.1. Company Overview
12.3.2. Product Offerings
12.3.3. Financial Performance
12.3.4. Recent Initiatives
12.4. Engie
12.4.1. Company Overview
12.4.2. Product Offerings
12.4.3. Financial Performance
12.4.4. Recent Initiatives
12.5. ITM Power
12.5.1. Company Overview
12.5.2. Product Offerings
12.5.3. Financial Performance
12.5.4. Recent Initiatives
12.6. Iwatani Corporation
12.6.1. Company Overview
12.6.2. Product Offerings
12.6.3. Financial Performance
12.6.4. Recent Initiatives
12.7. Linde plc
12.7.1. Company Overview
12.7.2. Product Offerings
12.7.3. Financial Performance
12.7.4. Recent Initiatives
12.8. Nedstack Fuel Cell Technology BV
12.8.1. Company Overview
12.8.2. Product Offerings
12.8.3. Financial Performance
12.8.4. Recent Initiatives
12.9. Nel ASA
12.9.1. Company Overview
12.9.2. Product Offerings
12.9.3. Financial Performance
12.9.4. Recent Initiatives
12.10. Steelhead Composites Inc.
12.10.1. Company Overview
12.10.2. Product Offerings
12.10.3. Financial Performance
12.10.4. Recent Initiatives
Chapter 13. Research Methodology
13.1. Primary Research
13.2. Secondary Research
13.3. Assumptions
Chapter 14. Appendix
14.1. About Us
14.2. Glossary of Terms
 Cross-segment Market Size and Analysis for
Mentioned Segments
 Additional Company Profiles (Upto 5 With No Cost)
 Additional Countries (Apart From Mentioned Countries)
 Country/Region-specific Report
 Go To Market Strategy
 Region Specific Market Dynamics
 Region Level Market Share
 Import Export Analysis
 Production Analysis
 Others