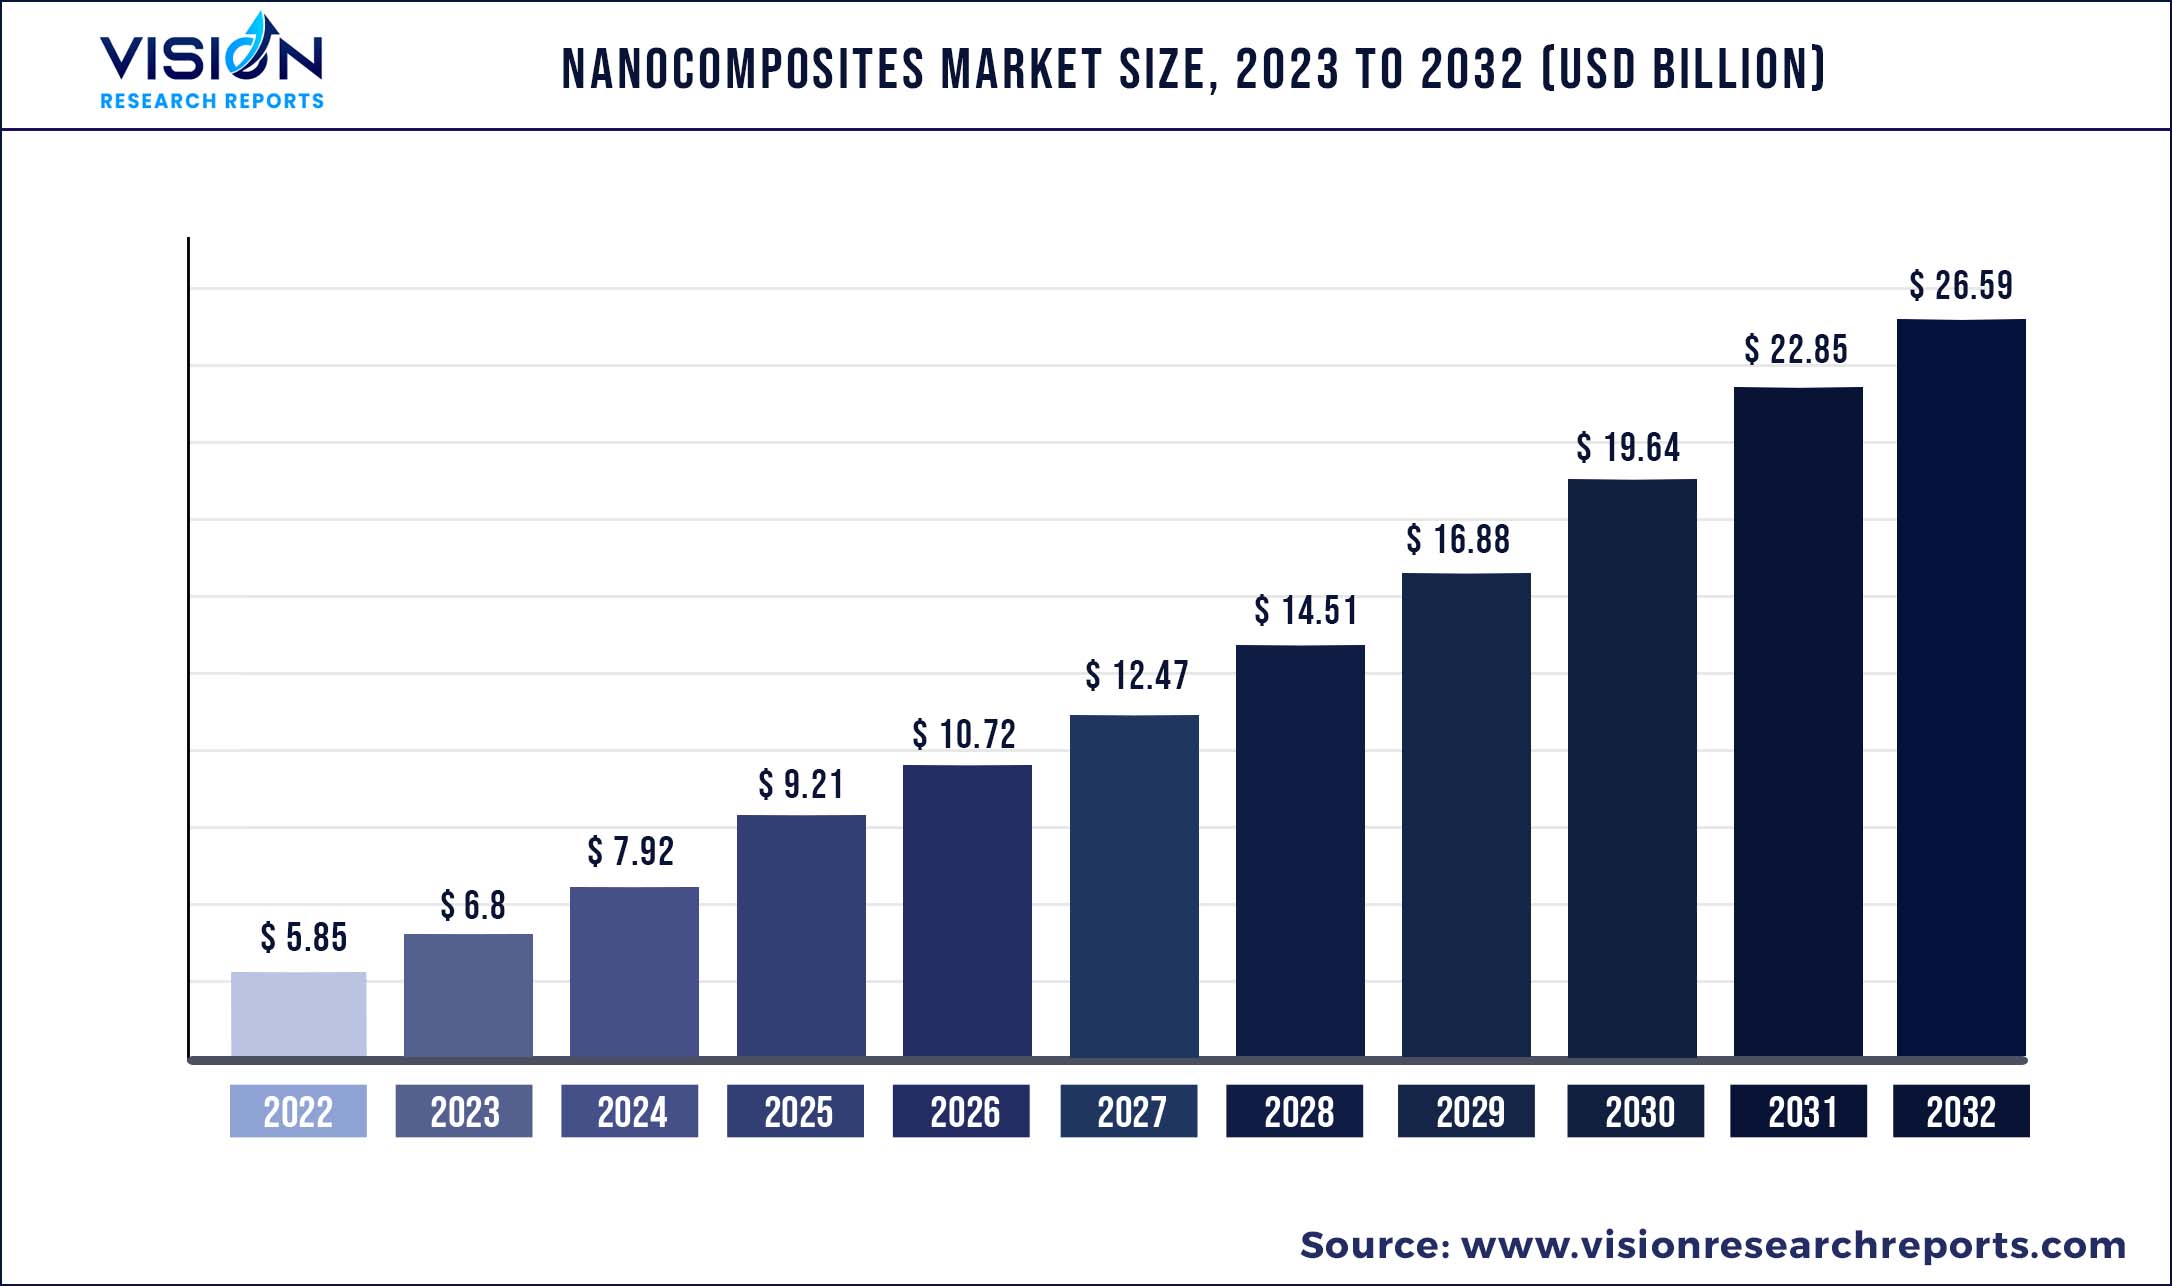
The global nanocomposites market was valued at USD 5.85 billion in 2022 and it is predicted to surpass around USD 26.59 billion by 2032 with a CAGR of 16.35% from 2023 to 2032.
Key Pointers
Report Scope of the Nanocomposites Market
| Report Coverage | Details |
| Market Size in 2022 | USD 5.85 billion |
| Revenue Forecast by 2032 | USD 26.59 billion |
| Growth rate from 2023 to 2032 | CAGR of 16.35% |
| Base Year | 2022 |
| Forecast Period | 2023 to 2032 |
| Regions Covered | North America, Europe, Asia Pacific, Latin America, Middle East & Africa |
| Companies Covered | Nanocor Inc., E. I. Du Pont De Nemours, Zyvex Technologies Inc., Arkema Inc., Showa Denko K.K., Powdermet Inc., RTP Company, Nanophase Technologies Corporation, Unidym Inc., and Nanocyl S.A. |
Increasing application of lightweight aluminum composite panels for insulation in the growing construction industry is projected to drive the industry over the forecast period.
Due to low permeability to gases, water, and hydrocarbons, nanocomposites are increasingly used in the food packaging industry, specifically in the packaging of cheese, confectionery, processed meat, boil-in-the-bag food, and cereals. In addition, nanocomposite polymers used in packaging help to reduce production waste and allow recycling, which is expected to propel industry growth.
In recent times, nanocomposites are gaining importance on account of their various abilities including high tensile strength, better optical and magnetic properties, high resistance to corrosion, and high thermal and electronic conductivity. These important characteristics have resulted in increased demand for nanocomposites in various industries.
The industry is expected to grow significantly over the forecast period on account of its wide range of applications including building and construction, automotive, electronics and electrical, IT, energy, and packaging. Products designed for biomedical purposes are referred as biomedical nanocomposites and are used in processes including tissue engineering, wound dressings, cancer therapy, stem cell therapy, cardiac prosthesis, and enzyme immobilization.
Raw materials such as glass fibers, clay, ceramics, carbon nanotubes, and other fillers are used in the manufacturing of the product. Polymer production is concentrated majorly in North America and Europe. Metal oxide production is also concentrated in North America and Europe owing to advanced technological development and increased investment in R&D.
Supportive government regulations regarding the use of nanocomposites in food and beverage packaging applications are expected to have a positive impact on growth. Furthermore, growing demand for bio-based high-performance products such as bacterial cellulose with polyvinyl alcohol (PVOH), cellulose nanocrystal-filled polyurethane (PU), polysulphone/cellulose nanocomposites, and cellulose nanocrystal-filled carboxymethyl cellulose is expected to propel the product demand over the forecast period.
Lack of technological development and high production cost involved in the manufacturing of nanocomposites are expected to hamper growth over the next few years. However, technological advancements related to optimizing production techniques in order to lower overall product cost is likely to ensure sustainability over the next few years.
Regional Outlook:
The Asia Pacific region is one of the leading consumers of nanocomposites and held the largest market share in 2019. The packaging industry in this part of the world is acting as the major driver. This market is witnessing continuous growth due to the presence of a large number of nanocomposite manufacturers as well as end user companies. The nanocomposite industry is quite developed in this region and the presence of huge number of automobile and electronic products manufacturers in China is providing a huge boost to the market’s growth. China is the largest consumer in this region and is consistently investing in new material types and R&D activities.
Nanocomposites Market Segmentations:
| By Type | By Product | By Application |
|
Polymer Metal Ceramic Others |
Carbon Nanotubes (CNT) Nanoclay Graphene Nanofiber Others |
Packaging Electrical & Electronics Automotive Aerospace & Defense Others |
Chapter 1. Introduction
1.1. Research Objective
1.2. Scope of the Study
1.3. Definition
Chapter 2. Research Methodology
2.1. Research Approach
2.2. Data Sources
2.3. Assumptions & Limitations
Chapter 3. Executive Summary
3.1. Market Snapshot
Chapter 4. Market Variables and Scope
4.1. Introduction
4.2. Market Classification and Scope
4.3. Industry Value Chain Analysis
4.3.1. Raw Material Procurement Analysis
4.3.2. Sales and Distribution Type Analysis
4.3.3. Downstream Buyer Analysis
Chapter 5. COVID 19 Impact on Nanocomposites Market
5.1. COVID-19 Landscape: Nanocomposites Industry Impact
5.2. COVID 19 - Impact Assessment for the Industry
5.3. COVID 19 Impact: Global Major Government Policy
5.4. Market Trends and Opportunities in the COVID-19 Landscape
Chapter 6. Market Dynamics Analysis and Trends
6.1. Market Dynamics
6.1.1. Market Drivers
6.1.2. Market Restraints
6.1.3. Market Opportunities
6.2. Porter’s Five Forces Analysis
6.2.1. Bargaining power of suppliers
6.2.2. Bargaining power of buyers
6.2.3. Threat of substitute
6.2.4. Threat of new entrants
6.2.5. Degree of competition
Chapter 7. Competitive Landscape
7.1.1. Company Market Share/Positioning Analysis
7.1.2. Key Strategies Adopted by Players
7.1.3. Vendor Landscape
7.1.3.1. List of Suppliers
7.1.3.2. List of Buyers
Chapter 8. Global Nanocomposites Market, By Type
8.1. Nanocomposites Market, by Type, 2023-2032
8.1.1 Polymer
8.1.1.1. Market Revenue and Forecast (2020-2032)
8.1.2. Metal
8.1.2.1. Market Revenue and Forecast (2020-2032)
8.1.3. Ceramic
8.1.3.1. Market Revenue and Forecast (2020-2032)
8.1.4. Others
8.1.4.1. Market Revenue and Forecast (2020-2032)
Chapter 9. Global Nanocomposites Market, By Product
9.1. Nanocomposites Market, by Product, 2023-2032
9.1.1. Carbon Nanotubes (CNT)
9.1.1.1. Market Revenue and Forecast (2020-2032)
9.1.2. Nanoclay
9.1.2.1. Market Revenue and Forecast (2020-2032)
9.1.3. Graphene
9.1.3.1. Market Revenue and Forecast (2020-2032)
9.1.4. Nanofiber
9.1.4.1. Market Revenue and Forecast (2020-2032)
9.1.5. Others
9.1.5.1. Market Revenue and Forecast (2020-2032)
Chapter 10. Global Nanocomposites Market, By Application
10.1. Nanocomposites Market, by Application, 2023-2032
10.1.1. Packaging
10.1.1.1. Market Revenue and Forecast (2020-2032)
10.1.2. Electrical & Electronics
10.1.2.1. Market Revenue and Forecast (2020-2032)
10.1.3. Automotive
10.1.3.1. Market Revenue and Forecast (2020-2032)
10.1.4. Aerospace & Defense
10.1.4.1. Market Revenue and Forecast (2020-2032)
10.1.5. Others
10.1.5.1. Market Revenue and Forecast (2020-2032)
Chapter 11. Global Nanocomposites Market, Regional Estimates and Trend Forecast
11.1. North America
11.1.1. Market Revenue and Forecast, by Type (2020-2032)
11.1.2. Market Revenue and Forecast, by Product (2020-2032)
11.1.3. Market Revenue and Forecast, by Application (2020-2032)
11.1.4. U.S.
11.1.4.1. Market Revenue and Forecast, by Type (2020-2032)
11.1.4.2. Market Revenue and Forecast, by Product (2020-2032)
11.1.4.3. Market Revenue and Forecast, by Application (2020-2032)
11.1.5. Rest of North America
11.1.5.1. Market Revenue and Forecast, by Type (2020-2032)
11.1.5.2. Market Revenue and Forecast, by Product (2020-2032)
11.1.5.3. Market Revenue and Forecast, by Application (2020-2032)
11.2. Europe
11.2.1. Market Revenue and Forecast, by Type (2020-2032)
11.2.2. Market Revenue and Forecast, by Product (2020-2032)
11.2.3. Market Revenue and Forecast, by Application (2020-2032)
11.2.4. UK
11.2.4.1. Market Revenue and Forecast, by Type (2020-2032)
11.2.4.2. Market Revenue and Forecast, by Product (2020-2032)
11.2.4.3. Market Revenue and Forecast, by Application (2020-2032)
11.2.5. Germany
11.2.5.1. Market Revenue and Forecast, by Type (2020-2032)
11.2.5.2. Market Revenue and Forecast, by Product (2020-2032)
11.2.5.3. Market Revenue and Forecast, by Application (2020-2032)
11.2.6. France
11.2.6.1. Market Revenue and Forecast, by Type (2020-2032)
11.2.6.2. Market Revenue and Forecast, by Product (2020-2032)
11.2.6.3. Market Revenue and Forecast, by Application (2020-2032)
11.2.7. Rest of Europe
11.2.7.1. Market Revenue and Forecast, by Type (2020-2032)
11.2.7.2. Market Revenue and Forecast, by Product (2020-2032)
11.2.7.3. Market Revenue and Forecast, by Application (2020-2032)
11.3. APAC
11.3.1. Market Revenue and Forecast, by Type (2020-2032)
11.3.2. Market Revenue and Forecast, by Product (2020-2032)
11.3.3. Market Revenue and Forecast, by Application (2020-2032)
11.3.4. India
11.3.4.1. Market Revenue and Forecast, by Type (2020-2032)
11.3.4.2. Market Revenue and Forecast, by Product (2020-2032)
11.3.4.3. Market Revenue and Forecast, by Application (2020-2032)
11.3.5. China
11.3.5.1. Market Revenue and Forecast, by Type (2020-2032)
11.3.5.2. Market Revenue and Forecast, by Product (2020-2032)
11.3.5.3. Market Revenue and Forecast, by Application (2020-2032)
11.3.6. Japan
11.3.6.1. Market Revenue and Forecast, by Type (2020-2032)
11.3.6.2. Market Revenue and Forecast, by Product (2020-2032)
11.3.6.3. Market Revenue and Forecast, by Application (2020-2032)
11.3.7. Rest of APAC
11.3.7.1. Market Revenue and Forecast, by Type (2020-2032)
11.3.7.2. Market Revenue and Forecast, by Product (2020-2032)
11.3.7.3. Market Revenue and Forecast, by Application (2020-2032)
11.4. MEA
11.4.1. Market Revenue and Forecast, by Type (2020-2032)
11.4.2. Market Revenue and Forecast, by Product (2020-2032)
11.4.3. Market Revenue and Forecast, by Application (2020-2032)
11.4.4. GCC
11.4.4.1. Market Revenue and Forecast, by Type (2020-2032)
11.4.4.2. Market Revenue and Forecast, by Product (2020-2032)
11.4.4.3. Market Revenue and Forecast, by Application (2020-2032)
11.4.5. North Africa
11.4.5.1. Market Revenue and Forecast, by Type (2020-2032)
11.4.5.2. Market Revenue and Forecast, by Product (2020-2032)
11.4.5.3. Market Revenue and Forecast, by Application (2020-2032)
11.4.6. South Africa
11.4.6.1. Market Revenue and Forecast, by Type (2020-2032)
11.4.6.2. Market Revenue and Forecast, by Product (2020-2032)
11.4.6.3. Market Revenue and Forecast, by Application (2020-2032)
11.4.7. Rest of MEA
11.4.7.1. Market Revenue and Forecast, by Type (2020-2032)
11.4.7.2. Market Revenue and Forecast, by Product (2020-2032)
11.4.7.3. Market Revenue and Forecast, by Application (2020-2032)
11.5. Latin America
11.5.1. Market Revenue and Forecast, by Type (2020-2032)
11.5.2. Market Revenue and Forecast, by Product (2020-2032)
11.5.3. Market Revenue and Forecast, by Application (2020-2032)
11.5.4. Brazil
11.5.4.1. Market Revenue and Forecast, by Type (2020-2032)
11.5.4.2. Market Revenue and Forecast, by Product (2020-2032)
11.5.4.3. Market Revenue and Forecast, by Application (2020-2032)
11.5.5. Rest of LATAM
11.5.5.1. Market Revenue and Forecast, by Type (2020-2032)
11.5.5.2. Market Revenue and Forecast, by Product (2020-2032)
11.5.5.3. Market Revenue and Forecast, by Application (2020-2032)
Chapter 12. Company Profiles
12.1. Nanocor Inc.
12.1.1. Company Overview
12.1.2. Product Offerings
12.1.3. Financial Performance
12.1.4. Recent Initiatives
12.2. E. I. Du Pont De Nemours
12.2.1. Company Overview
12.2.2. Product Offerings
12.2.3. Financial Performance
12.2.4. Recent Initiatives
12.3. Zyvex Technologies Inc.
12.3.1. Company Overview
12.3.2. Product Offerings
12.3.3. Financial Performance
12.3.4. Recent Initiatives
12.4. Arkema Inc.
12.4.1. Company Overview
12.4.2. Product Offerings
12.4.3. Financial Performance
12.4.4. Recent Initiatives
12.5. Showa Denko K.K.
12.5.1. Company Overview
12.5.2. Product Offerings
12.5.3. Financial Performance
12.5.4. Recent Initiatives
12.6. Powdermet Inc.
12.6.1. Company Overview
12.6.2. Product Offerings
12.6.3. Financial Performance
12.6.4. Recent Initiatives
12.7. RTP Company
12.7.1. Company Overview
12.7.2. Product Offerings
12.7.3. Financial Performance
12.7.4. Recent Initiatives
12.8. Nanophase Technologies Corporation
12.8.1. Company Overview
12.8.2. Product Offerings
12.8.3. Financial Performance
12.8.4. Recent Initiatives
12.9. Unidym Inc.
12.9.1. Company Overview
12.9.2. Product Offerings
12.9.3. Financial Performance
12.9.4. Recent Initiatives
12.10. Nanocyl S.A.
12.10.1. Company Overview
12.10.2. Product Offerings
12.10.3. Financial Performance
12.10.4. Recent Initiatives
Chapter 13. Research Methodology
13.1. Primary Research
13.2. Secondary Research
13.3. Assumptions
Chapter 14. Appendix
14.1. About Us
14.2. Glossary of Terms
 Cross-segment Market Size and Analysis for
Mentioned Segments
Additional Company Profiles (Upto 5 With No Cost)
Additional Countries (Apart From Mentioned Countries)
Country/Region-specific Report
Go To Market Strategy
Region Specific Market DynamicsRegion Level Market Share Import Export AnalysisProduction AnalysisOthers
Cross-segment Market Size and Analysis for
Mentioned Segments
Additional Company Profiles (Upto 5 With No Cost)
Additional Countries (Apart From Mentioned Countries)
Country/Region-specific Report
Go To Market Strategy
Region Specific Market DynamicsRegion Level Market Share Import Export AnalysisProduction AnalysisOthers