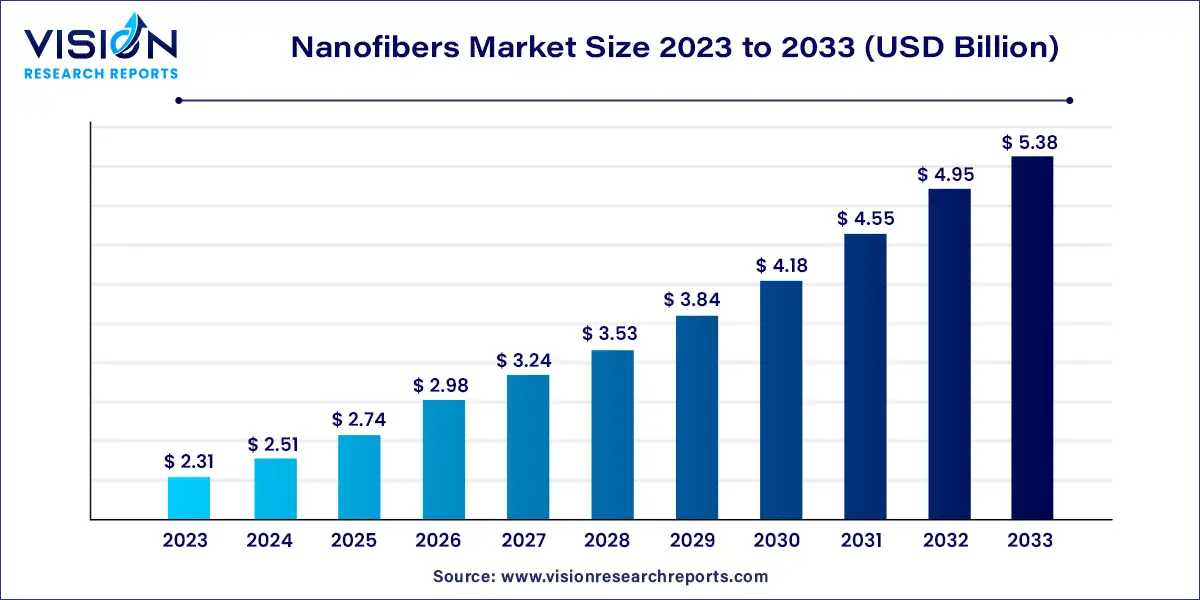
The global nanofibers market size was valued at USD 2.31 billion in 2023 and is anticipated to reach around USD 5.38 billion by 2033, growing at a CAGR of 8.83% from 2024 to 2033. Nanofibers, with diameters in the nanometer range, have gained significant attention due to their unique properties and potential applications across various industries. These ultra-thin fibers exhibit remarkable mechanical, electrical, and thermal characteristics, making them ideal for use in diverse fields such as textiles, medicine, electronics, and environmental protection.

The nanofibers market is experiencing robust growth driven the technological advancements in fabrication techniques, such as electrospinning and nanomaterial synthesis, have significantly enhanced the production efficiency and quality of nanofibers. These innovations have expanded their applications across various industries, including textiles, electronics, and medicine. Additionally, the rising demand for high-performance materials in healthcare, particularly for applications like wound healing and tissue engineering, is fueling market expansion. The increasing focus on sustainability and environmental protection also contributes to market growth, as nanofibers are utilized in filtration systems and energy storage solutions. Furthermore, the growing consumer awareness and adoption of advanced materials in everyday products are boosting the market’s momentum.
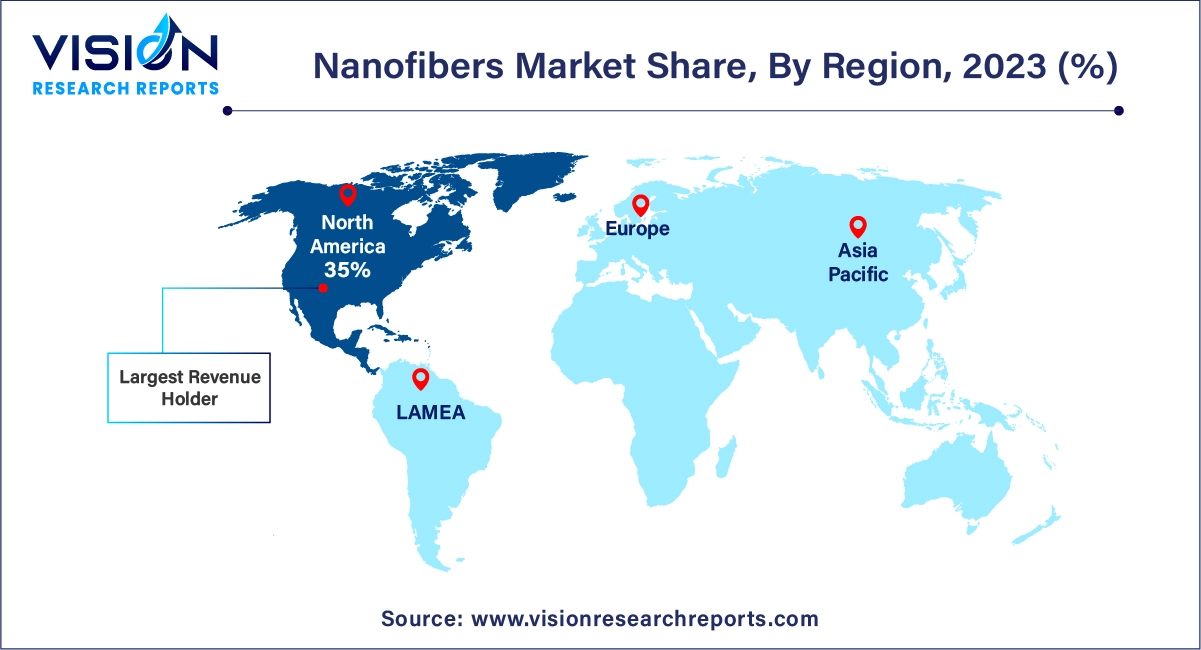
North America led the global nanofibers market with a 35% revenue share in 2023. This dominance is due to the region's robust technological infrastructure, active industrial sectors, and significant investments in research and development. North America's focus on advancing healthcare technologies is accelerating the use of nanofibers in medical devices, tissue engineering, and drug delivery systems.
| Attribute | Asia Pacific |
| Market Value | USD 0.80 Billion |
| Growth Rate | 8.84% CAGR |
| Projected Value | USD 1.88 Billion |
Europe was identified as a promising market in 2023. The region benefits from a strong industrial base, substantial government and private sector funding for nanotechnology research, and stringent regulations promoting advanced materials. European countries are at the forefront of integrating nanofibers into various industries, especially healthcare, where they are utilized in advanced wound care, drug delivery systems, and regenerative medicine.

Asia Pacific is expected to experience the fastest growth in the nanofibers market, with a projected CAGR of 9.33% during the forecast period. This growth is driven by expanding industrial sectors, increased research and development efforts, and growing awareness of nanotechnology benefits. Countries like China, Japan, and South Korea are leading in production and application, supported by government initiatives, investments, and academic collaborations. The demand for sustainable solutions, such as water and air filtration, further enhances the market’s appeal.
In 2023, polymers dominated the nanofibers market with a substantial revenue share of 47%. Known for their flexibility, lightweight nature, and high surface-to-volume ratio, polymer nanofibers are pivotal in various applications, including healthcare and environmental engineering. In the medical field, they are revolutionizing tissue engineering, wound healing, and drug delivery due to their biocompatibility and ability to mimic the extracellular matrix. Their porous structure also makes them highly effective for air and water filtration systems. Additionally, in electronics, they are used in flexible sensors, actuators, and substrates for electronic devices, combining mechanical flexibility with functional performance.
Cellulose nanofibers are anticipated to experience the highest growth rate, with a projected CAGR of 9.53% over the forecast period. This growth is attributed to their increasing use in cosmetics, paints, optical films, and other applications. The lightweight, high-strength, and eco-friendly properties of cellulose nanofibers are driving their global adoption and market expansion.
The Mechanical, Chemical, & Environmental (MCE) segment led the market with a 37% revenue share in 2023. Nanofibers excel in air and aerosol filtration due to their large surface area relative to their volume, making them highly effective at capturing pollutants. The growing emphasis on stringent environmental regulations and concerns about air and water quality is driving demand for these filtration solutions within the MCE sector.
The electronics segment is expected to grow at the fastest CAGR of 9.73% during the forecast period. Nanofibers are crucial in developing flexible electronics, including wearable technology, bendable screens, and smart fabrics. They also enhance energy storage and conversion technologies, such as batteries and supercapacitors, by improving energy density and charge-discharge rates.
By Product
By End Use
By Region
Chapter 1. Introduction
1.1. Research Objective
1.2. Scope of the Study
1.3. Definition
Chapter 2. Research Methodology
2.1. Research Approach
2.2. Data Sources
2.3. Assumptions & Limitations
Chapter 3. Executive Summary
3.1. Market Snapshot
Chapter 4. Market Variables and Scope
4.1. Introduction
4.2. Market Classification and Scope
4.3. Industry Value Chain Analysis
4.3.1. Raw Material Procurement Analysis
4.3.2. Sales and Distribution Channel Analysis
4.3.3. Downstream Buyer Analysis
Chapter 5. COVID 19 Impact on Nanofibers Market
5.1. COVID-19 Landscape: Nanofibers Industry Impact
5.2. COVID 19 - Impact Assessment for the Industry
5.3. COVID 19 Impact: Global Major Government Policy
5.4. Market Trends and Opportunities in the COVID-19 Landscape
Chapter 6. Market Dynamics Analysis and Trends
6.1. Market Dynamics
6.1.1. Market Drivers
6.1.2. Market Restraints
6.1.3. Market Opportunities
6.2. Porter’s Five Forces Analysis
6.2.1. Bargaining power of suppliers
6.2.2. Bargaining power of buyers
6.2.3. Threat of substitute
6.2.4. Threat of new entrants
6.2.5. Degree of competition
Chapter 7. Competitive Landscape
7.1.1. Company Market Share/Positioning Analysis
7.1.2. Key Strategies Adopted by Players
7.1.3. Vendor Landscape
7.1.3.1. List of Suppliers
7.1.3.2. List of Buyers
Chapter 8. Global Nanofibers Market, By Product
8.1. Nanofibers Market, by Product, 2024-2033
8.1.1. Polymer
8.1.1.1. Market Revenue and Forecast (2021-2033)
8.1.2. Carbon
8.1.2.1. Market Revenue and Forecast (2021-2033)
8.1.3. Cellulose
8.1.3.1. Market Revenue and Forecast (2021-2033)
8.1.4. Composite
8.1.4.1. Market Revenue and Forecast (2021-2033)
8.1.5. Metallic
8.1.5.1. Market Revenue and Forecast (2021-2033)
8.1.6. Other Products
8.1.6.1. Market Revenue and Forecast (2021-2033)
Chapter 9. Global Nanofibers Market, By End Use
9.1. Nanofibers Market, by End Use, 2024-2033
9.1.1. Electronics
9.1.1.1. Market Revenue and Forecast (2021-2033)
9.1.2. MCE
9.1.2.1. Market Revenue and Forecast (2021-2033)
9.1.3. Energy
9.1.3.1. Market Revenue and Forecast (2021-2033)
9.1.4. MLP
9.1.4.1. Market Revenue and Forecast (2021-2033)
9.1.5. Other End Uses
9.1.5.1. Market Revenue and Forecast (2021-2033)
Chapter 10. Global Nanofibers Market, Regional Estimates and Trend Forecast
10.1. North America
10.1.1. Market Revenue and Forecast, by Product (2021-2033)
10.1.2. Market Revenue and Forecast, by End Use (2021-2033)
10.1.3. U.S.
10.1.3.1. Market Revenue and Forecast, by Product (2021-2033)
10.1.3.2. Market Revenue and Forecast, by End Use (2021-2033)
10.1.4. Rest of North America
10.1.4.1. Market Revenue and Forecast, by Product (2021-2033)
10.1.4.2. Market Revenue and Forecast, by End Use (2021-2033)
10.2. Europe
10.2.1. Market Revenue and Forecast, by Product (2021-2033)
10.2.2. Market Revenue and Forecast, by End Use (2021-2033)
10.2.3. UK
10.2.3.1. Market Revenue and Forecast, by Product (2021-2033)
10.2.3.2. Market Revenue and Forecast, by End Use (2021-2033)
10.2.4. Germany
10.2.4.1. Market Revenue and Forecast, by Product (2021-2033)
10.2.4.2. Market Revenue and Forecast, by End Use (2021-2033)
10.2.5. France
10.2.5.1. Market Revenue and Forecast, by Product (2021-2033)
10.2.5.2. Market Revenue and Forecast, by End Use (2021-2033)
10.2.6. Rest of Europe
10.2.6.1. Market Revenue and Forecast, by Product (2021-2033)
10.2.6.2. Market Revenue and Forecast, by End Use (2021-2033)
10.3. APAC
10.3.1. Market Revenue and Forecast, by Product (2021-2033)
10.3.2. Market Revenue and Forecast, by End Use (2021-2033)
10.3.3. India
10.3.3.1. Market Revenue and Forecast, by Product (2021-2033)
10.3.3.2. Market Revenue and Forecast, by End Use (2021-2033)
10.3.4. China
10.3.4.1. Market Revenue and Forecast, by Product (2021-2033)
10.3.4.2. Market Revenue and Forecast, by End Use (2021-2033)
10.3.5. Japan
10.3.5.1. Market Revenue and Forecast, by Product (2021-2033)
10.3.5.2. Market Revenue and Forecast, by End Use (2021-2033)
10.3.6. Rest of APAC
10.3.6.1. Market Revenue and Forecast, by Product (2021-2033)
10.3.6.2. Market Revenue and Forecast, by End Use (2021-2033)
10.4. MEA
10.4.1. Market Revenue and Forecast, by Product (2021-2033)
10.4.2. Market Revenue and Forecast, by End Use (2021-2033)
10.4.3. GCC
10.4.3.1. Market Revenue and Forecast, by Product (2021-2033)
10.4.3.2. Market Revenue and Forecast, by End Use (2021-2033)
10.4.4. North Africa
10.4.4.1. Market Revenue and Forecast, by Product (2021-2033)
10.4.4.2. Market Revenue and Forecast, by End Use (2021-2033)
10.4.5. South Africa
10.4.5.1. Market Revenue and Forecast, by Product (2021-2033)
10.4.5.2. Market Revenue and Forecast, by End Use (2021-2033)
10.4.6. Rest of MEA
10.4.6.1. Market Revenue and Forecast, by Product (2021-2033)
10.4.6.2. Market Revenue and Forecast, by End Use (2021-2033)
10.5. Latin America
10.5.1. Market Revenue and Forecast, by Product (2021-2033)
10.5.2. Market Revenue and Forecast, by End Use (2021-2033)
10.5.3. Brazil
10.5.3.1. Market Revenue and Forecast, by Product (2021-2033)
10.5.3.2. Market Revenue and Forecast, by End Use (2021-2033)
10.5.4. Rest of LATAM
10.5.4.1. Market Revenue and Forecast, by Product (2021-2033)
10.5.4.2. Market Revenue and Forecast, by End Use (2021-2033)
Chapter 11. Company Profiles
11.1. Ahlstrom
11.1.1. Company Overview
11.1.2. Product Offerings
11.1.3. Financial Performance
11.1.4. Recent Initiatives
11.2. TORAY INDUSTRIES, INC.
11.2.1. Company Overview
11.2.2. Product Offerings
11.2.3. Financial Performance
11.2.4. Recent Initiatives
11.3. DuPont
11.3.1. Company Overview
11.3.2. Product Offerings
11.3.3. Financial Performance
11.3.4. Recent Initiatives
11.4. Asahi Kasei Corporation
11.4.1. Company Overview
11.4.2. Product Offerings
11.4.3. Financial Performance
11.4.4. LTE Scientific
11.5. Donaldson Company, Inc.
11.5.1. Company Overview
11.5.2. Product Offerings
11.5.3. Financial Performance
11.5.4. Recent Initiatives
11.6. Elmarco Ltd.
11.6.1. Company Overview
11.6.2. Product Offerings
11.6.3. Financial Performance
11.6.4. Recent Initiatives
11.7. Johns Manville. A Berkshire Hathaway Company
11.7.1. Company Overview
11.7.2. Product Offerings
11.7.3. Financial Performance
11.7.4. Recent Initiatives
11.8. Jiangxi Xian Cai Nanofibers Technology Co., Ltd.
11.8.1. Company Overview
11.8.2. Product Offerings
11.8.3. Financial Performance
11.8.4. Recent Initiatives
Chapter 12. Research Methodology
12.1. Primary Research
12.2. Secondary Research
12.3. Assumptions
Chapter 13. Appendix
13.1. About Us
13.2. Glossary of Terms
 Cross-segment Market Size and Analysis for
Mentioned Segments
 Additional Company Profiles (Upto 5 With No Cost)
 Additional Countries (Apart From Mentioned Countries)
 Country/Region-specific Report
 Go To Market Strategy
 Region Specific Market Dynamics
 Region Level Market Share
 Import Export Analysis
 Production Analysis
 Others