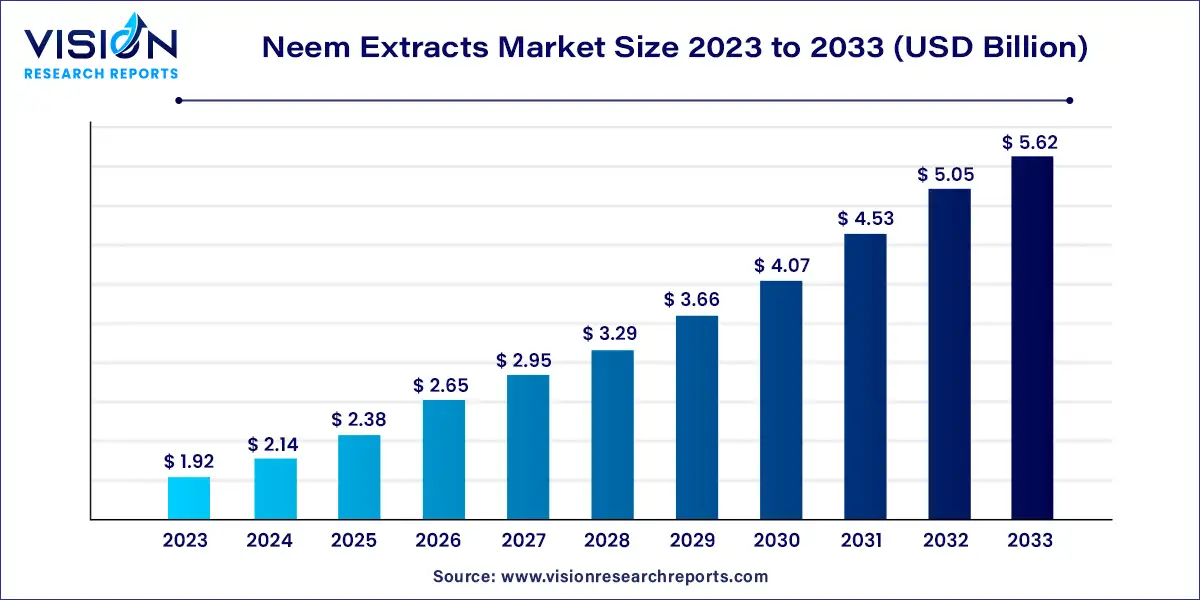
The global neem extracts market size was estimated at USD 1.92 billion in 2023 and it is expected to surpass around USD 5.62 billion by 2033, poised to grow at a CAGR of 11.34% from 2024 to 2033. Neem extracts are derived from various parts of the neem tree (Azadirachta indica), a tree native to India and other parts of Southeast Asia. Known for its medicinal and agricultural applications, neem has been used for centuries in traditional practices. The global neem extracts market has experienced significant growth due to the rising demand for natural and organic products across industries such as cosmetics, agriculture, and pharmaceuticals.

The growth of the neem extracts market is largely attributed to the increasing consumer preference for natural and organic products is a major driver. As awareness of the benefits of synthetic-free products rises, neem extracts are gaining popularity for their efficacy and eco-friendly profile. In the agricultural sector, neem extracts are valued for their pesticidal properties, offering an organic alternative to chemical pesticides. This shift towards sustainable agriculture practices is fueling market growth. Additionally, the expanding use of neem in traditional medicine and its potential in modern therapeutic applications are contributing to its market expansion. The versatility of neem extracts in various industries, coupled with growing environmental concerns, underscores their increasing significance and adoption.
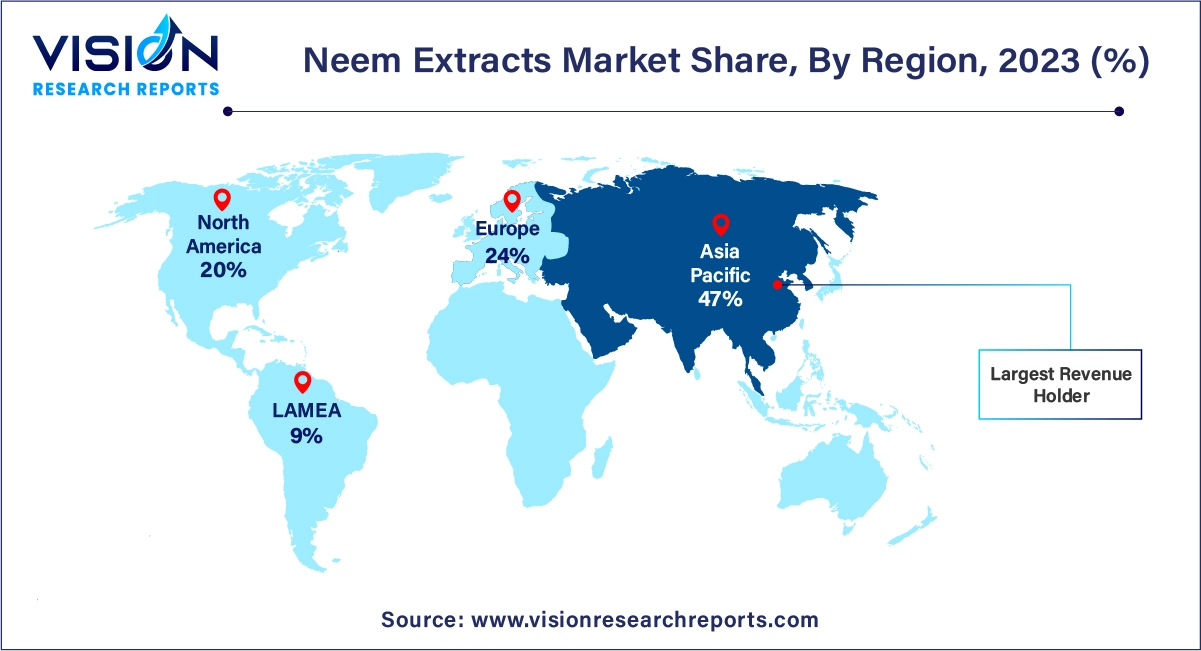
The Asia Pacific neem extracts market dominated with a 47% share in 2023. This is due to the rising consumer demand for sustainable, organic, and effective personal care products. Neem extracts, rich in bioactive components, are increasingly appreciated for their benefits for skin and hair. They are also used in nutraceutical and dietary supplements, contributing to health benefits such as lowering blood pressure, reducing cholesterol, and aiding digestion.
| Attribute | Asia Pacific |
| Market Value | USD 0.90 Billion |
| Growth Rate | 11.35% CAGR |
| Projected Value | USD 2.64 Billion |
In 2023, the North American neem extracts market held an 20% share. The prominence of neem extracts in this region is largely due to stringent regulations on synthetic agricultural ingredients in personal care and cosmetics. With a growing consumer preference for herbal ingredients, neem extracts are increasingly being adopted in beauty products.

In Europe, the neem extracts market held a substantial share of 24%. This growth is driven by rigorous government regulations on chemical fertilizers, which have encouraged the adoption of organic alternatives. Farmers are turning to neem-based biopesticides for their eco-friendly nature and effectiveness in pest control. Additionally, neem extracts are used in livestock farming to promote animal health and well-being, and they play a role in sustainable soil management and crop cultivation.
In 2023, fertilizers captured the largest market share at 67%, driven by the growing adoption of bio-fertilizers and bio-pesticides among farmers, especially in developed regions. This shift is largely due to increasing concerns about human health and environmental impact. Neem-based fertilizers, which serve as organic alternatives to synthetic chemicals, are crucial in advancing sustainable farming practices. They enhance soil health, aid in pest control, and maintain ecological balance. The introduction of innovative neem-based products such as neem cake, neem oil, neem-coated urea, and biopesticides has significantly expanded the market. This innovation has led farmers to favor bio-based solutions over chemical ones for improving soil structure, supplying essential nutrients, and producing chemical-free fruits and vegetables.
In personal care applications, the demand for neem extracts is expected to grow substantially during the forecast period. This surge is attributed to rising consumer interest in natural and organic ingredients. Neem extracts are valued for their antibacterial, antifungal, and anti-inflammatory properties, making them ideal for inclusion in skincare products like creams, lotions, and soaps, as well as hair care products such as shampoos and conditioners. Additionally, neem’s antioxidant-rich profile helps combat free radicals, preventing premature aging. Its antimicrobial effects are beneficial for treating acne and other skin issues, further driving the inclusion of neem extracts in personal care formulations.
By Application
By Region
Chapter 1. Introduction
1.1. Research Objective
1.2. Scope of the Study
1.3. Definition
Chapter 2. Research Methodology
2.1. Research Approach
2.2. Data Sources
2.3. Assumptions & Limitations
Chapter 3. Executive Summary
3.1. Market Snapshot
Chapter 4. Market Variables and Scope
4.1. Introduction
4.2. Market Classification and Scope
4.3. Industry Value Chain Analysis
4.3.1. Raw Material Procurement Analysis
4.3.2. Sales and Distribution Channel Analysis
4.3.3. Downstream Buyer Analysis
Chapter 5. COVID 19 Impact on Neem Extracts Market
5.1. COVID-19 Landscape: Neem Extracts Industry Impact
5.2. COVID 19 - Impact Assessment for the Industry
5.3. COVID 19 Impact: Global Major Government Policy
5.4. Market Trends and Opportunities in the COVID-19 Landscape
Chapter 6. Market Dynamics Analysis and Trends
6.1. Market Dynamics
6.1.1. Market Drivers
6.1.2. Market Restraints
6.1.3. Market Opportunities
6.2. Porter’s Five Forces Analysis
6.2.1. Bargaining power of suppliers
6.2.2. Bargaining power of buyers
6.2.3. Threat of substitute
6.2.4. Threat of new entrants
6.2.5. Degree of competition
Chapter 7. Competitive Landscape
7.1.1. Company Market Share/Positioning Analysis
7.1.2. Key Strategies Adopted by Players
7.1.3. Vendor Landscape
7.1.3.1. List of Suppliers
7.1.3.2. List of Buyers
Chapter 8. Global Neem Extracts Market, By Application
8.1.Neem Extracts Market, by Application Type, 2024-2033
8.1.1. Personal Care
8.1.1.1. Market Revenue and Forecast (2021-2033)
8.1.2. Pharmaceutical
8.1.2.1. Market Revenue and Forecast (2021-2033)
8.1.3. Fertilizers
8.1.3.1. Market Revenue and Forecast (2021-2033)
8.1.4. Animal Feed
8.1.4.1. Market Revenue and Forecast (2021-2033)
8.1.5. Others
8.1.5.1. Market Revenue and Forecast (2021-2033)
Chapter 9. Global Neem Extracts Market, Regional Estimates and Trend Forecast
9.1. North America
9.1.1. Market Revenue and Forecast, by Application (2021-2033)
9.1.2. U.S.
9.1.2.1. Market Revenue and Forecast, by Application (2021-2033)
9.1.3. Rest of North America
9.1.3.1. Market Revenue and Forecast, by Application (2021-2033)
9.2. Europe
9.2.1. Market Revenue and Forecast, by Application (2021-2033)
9.2.2. UK
9.2.2.1. Market Revenue and Forecast, by Application (2021-2033)
9.2.3. Germany
9.2.3.1. Market Revenue and Forecast, by Application (2021-2033)
9.2.4. France
9.2.4.1. Market Revenue and Forecast, by Application (2021-2033)
9.2.5. Rest of Europe
9.2.5.1. Market Revenue and Forecast, by Application (2021-2033)
9.3. APAC
9.3.1. Market Revenue and Forecast, by Application (2021-2033)
9.3.2. India
9.3.2.1. Market Revenue and Forecast, by Application (2021-2033)
9.3.3. China
9.3.3.1. Market Revenue and Forecast, by Application (2021-2033)
9.3.4. Japan
9.3.4.1. Market Revenue and Forecast, by Application (2021-2033)
9.3.5. Rest of APAC
9.3.5.1. Market Revenue and Forecast, by Application (2021-2033)
9.4. MEA
9.4.1. Market Revenue and Forecast, by Application (2021-2033)
9.4.2. GCC
9.4.2.1. Market Revenue and Forecast, by Application (2021-2033)
9.4.3. North Africa
9.4.3.1. Market Revenue and Forecast, by Application (2021-2033)
9.4.4. South Africa
9.4.4.1. Market Revenue and Forecast, by Application (2021-2033)
9.4.5. Rest of MEA
9.4.5.1. Market Revenue and Forecast, by Application (2021-2033)
9.5. Latin America
9.5.1. Market Revenue and Forecast, by Application (2021-2033)
9.5.2. Brazil
9.5.2.1. Market Revenue and Forecast, by Application (2021-2033)
9.5.3. Rest of LATAM
9.5.3.1. Market Revenue and Forecast, by Application (2021-2033)
Chapter 10. Company Profiles
10.1. Parker Biotech Private Limited
10.1.1. Company Overview
10.1.2. Product Offerings
10.1.3. Financial Performance
10.1.4. Recent Initiatives
10.2. Agro Extracts Limited
10.2.1. Company Overview
10.2.2. Product Offerings
10.2.3. Financial Performance
10.2.4. Recent Initiatives
10.3. Fortune Biotech
10.3.1. Company Overview
10.3.2. Product Offerings
10.3.3. Financial Performance
10.3.4. Recent Initiatives
10.4. Ozone Biotech
10.4.1. Company Overview
10.4.2. Product Offerings
10.4.3. Financial Performance
10.4.4. Recent Initiatives
10.5. PJ Margo
10.5.1. Company Overview
10.5.2. Product Offerings
10.5.3. Financial Performance
10.5.4. Recent Initiatives
10.6. GreeNeem
10.6.1. Company Overview
10.6.2. Product Offerings
10.6.3. Financial Performance
10.6.4. Recent Initiatives
10.7. Trifolio-M
10.7.1. Company Overview
10.7.2. Product Offerings
10.7.3. Financial Performance
10.7.4. Recent Initiatives
10.8. EID Parry
10.8.1. Company Overview
10.8.2. Product Offerings
10.8.3.Financial Performance
10.8.4. Recent Initiatives
10.9. Herbal Creation
10.9.1. Company Overview
10.9.2. Product Offerings
10.9.3. Financial Performance
10.9.4. Recent Initiatives
10.10. Phyto Life Sciences P. Ltd.
10.10.1. Company Overview
10.10.2. Product Offerings
10.10.3. Financial Performance
10.10.4. Recent Initiatives
Chapter 11. Research Methodology
11.1. Primary Research
11.2. Secondary Research
11.3. Assumptions
Chapter 12. Appendix
12.1. About Us
12.2. Glossary of Terms
 Cross-segment Market Size and Analysis for
Mentioned Segments
 Additional Company Profiles (Upto 5 With No Cost)
 Additional Countries (Apart From Mentioned Countries)
 Country/Region-specific Report
 Go To Market Strategy
 Region Specific Market Dynamics
 Region Level Market Share
 Import Export Analysis
 Production Analysis
 Others