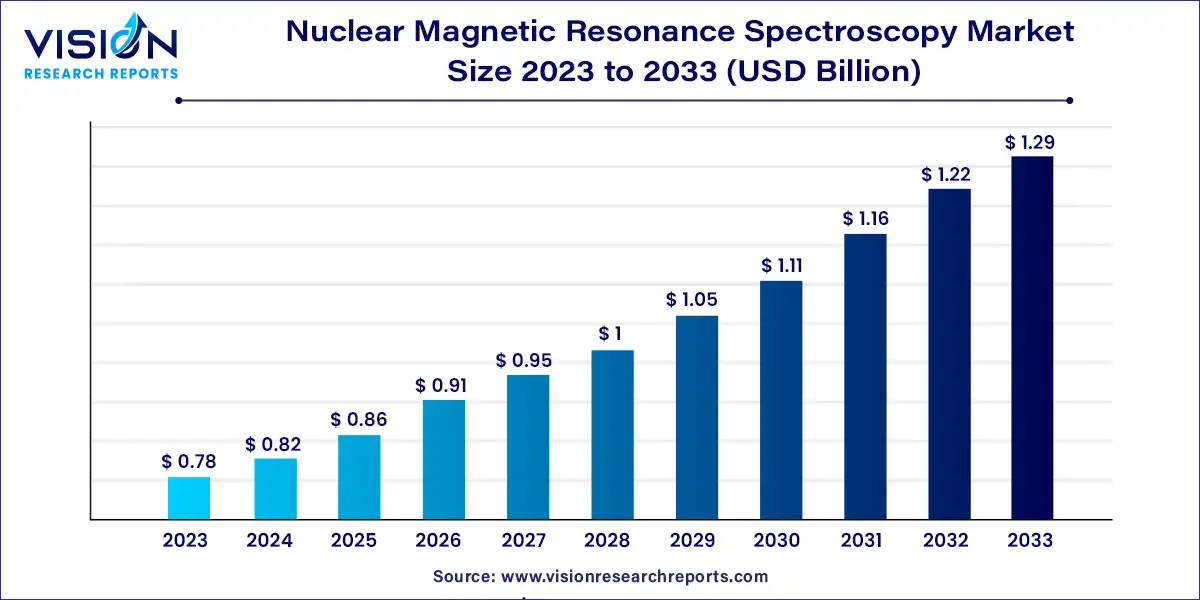
The global nuclear magnetic resonance spectroscopy market size was estimated at around USD 0.78 billion in 2023 and it is projected to hit around USD 1.29 billion by 2033, growing at a CAGR of 5.12% from 2024 to 2033.

Nuclear magnetic resonance (NMR) spectroscopy has emerged as a pivotal analytical technique in various scientific disciplines, including chemistry, biochemistry, and medicine. This non-destructive method provides detailed insights into the structure, dynamics, and interactions of molecules by exploiting the magnetic properties of atomic nuclei. The global market for NMR spectroscopy is witnessing steady growth, driven by increasing applications across research institutions, pharmaceutical companies, and clinical diagnostics.
The growth of the nuclear magnetic resonance (NMR) spectroscopy market is driven by an advancements in technology, particularly in magnet technology and software algorithms that enhance instrument sensitivity and resolution. This has expanded the application of NMR spectroscopy in complex molecular analysis across various sectors such as pharmaceuticals, biotechnology, and materials science. Additionally, the increasing research activities in drug discovery and biomolecular research, coupled with its non-invasive clinical applications in disease diagnostics, contribute significantly to market expansion.
Instruments maintained market dominance with an 81% share in 2023, driven by increased adoption in research. Notably, Numares' FDA approval of the AXINON System in July 2023 for cardiovascular lipoprotein analysis marked a significant milestone. Advancements in spectrometer technology, including enhanced detector integration, optical designs, and advanced software, are expected to further propel instrument adoption by 2033. Additionally, the introduction of innovative technologies through new product launches is set to positively impact segment growth.
The Consumables segment is poised to register the fastest CAGR during the forecast period. This growth is fueled by rising demand for advanced analytical techniques across pharmaceuticals, materials science, and biotechnology. NMR consumables such as specialized sample tubes and solvents are critical for ensuring precise and reproducible experimental outcomes. For instance, JEOL Ltd.'s introduction of the Cryogen Reclamation System in April 2023, aimed at reducing cryogenic material evaporation in NMR instruments, illustrates ongoing product innovations driving segment expansion.
Academic institutions led the nuclear magnetic resonance spectroscopy market with a 47% share in 2023. Increased investments in advanced analytical instrumentation within academia are expected to accelerate segment growth. For example, the University of Warwick's USD 20.7 million funding in December 2022 for a 1.2 GHz NMR instrument underscores this trend. Moreover, academic institutions play a pivotal role in knowledge transfer through seminars and meetings, further boosting segment growth.
The Agriculture and Food segment is forecasted to experience rapid growth during the forecast period. In the food industry, NMR supports quality assessment and authenticity verification, crucial for detecting contaminants in products like olive oil and fruit juices. Additionally, in agriculture, NMR aids in soil analysis to optimize fertilization strategies and enhance crop productivity while minimizing environmental impact.
High-field NMR spectroscopy dominated with an 89% market share in 2023, driven by technological advancements and increasing demand across various sectors. Advancements such as cryogen-free spectrometers and enhanced data analysis software have made high-field NMR more accessible, efficient, and cost-effective. Its extensive applications in organic chemistry, biochemistry, and pharmaceuticals for detailed molecular structure analysis are expected to sustain steady market growth.
Low-field NMR spectroscopy is projected to record the fastest CAGR, driven by its affordability and versatile applications across industries. Operating at fields below 100 MHz, low-field NMR systems offer cost-effective solutions suitable for academic, research, and industrial settings. The affordability and efficiency of benchtop spectrometers, demonstrated in research at Aston University in September 2023, highlight their potential in expanding NMR applications.
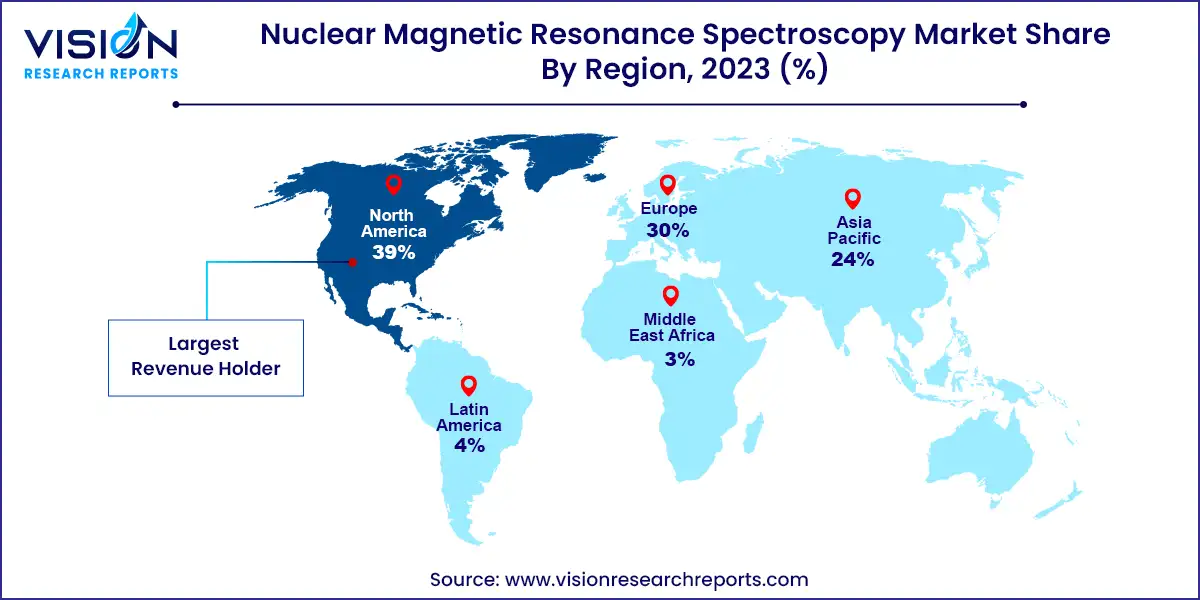
North America held a significant share of 39% in the global NMR spectroscopy market, driven by a robust pharmaceutical industry and healthcare infrastructure in the U.S. Demand for NMR spectroscopy in clinical diagnostics and research further supports market growth in the region.

The Asia Pacific region is poised to witness the fastest CAGR, fueled by expanding pharmaceutical and biotechnology industries in countries like China and India. Government initiatives supporting healthcare advancements and ongoing innovations in disease research are anticipated to drive market expansion in this dynamic region.
By Product
By Type
By End-use
By Region
Chapter 1. Introduction
1.1. Research Objective
1.2. Scope of the Study
1.3. Definition
Chapter 2. Research Methodology
2.1. Research Approach
2.2. Data Sources
2.3. Assumptions & Limitations
Chapter 3. Executive Summary
3.1. Market Snapshot
Chapter 4. Market Variables and Scope
4.1. Introduction
4.2. Market Classification and Scope
4.3. Industry Value Chain Analysis
4.3.1. Raw Material Procurement Analysis
4.3.2. Sales and Distribution Channel Analysis
4.3.3. Downstream Buyer Analysis
Chapter 5. COVID 19 Impact on Nuclear Magnetic Resonance Spectroscopy Market
5.1. COVID-19 Landscape: Nuclear Magnetic Resonance Spectroscopy Industry Impact
5.2. COVID 19 - Impact Assessment for the Industry
5.3. COVID 19 Impact: Global Major Government Policy
5.4. Market Trends and Opportunities in the COVID-19 Landscape
Chapter 6. Market Dynamics Analysis and Trends
6.1. Market Dynamics
6.1.1. Market Drivers
6.1.2. Market Restraints
6.1.3. Market Opportunities
6.2. Porter’s Five Forces Analysis
6.2.1. Bargaining power of suppliers
6.2.2. Bargaining power of buyers
6.2.3. Threat of substitute
6.2.4. Threat of new entrants
6.2.5. Degree of competition
Chapter 7. Competitive Landscape
7.1.1. Company Market Share/Positioning Analysis
7.1.2. Key Strategies Adopted by Players
7.1.3. Vendor Landscape
7.1.3.1. List of Suppliers
7.1.3.2. List of Buyers
Chapter 8. Global Nuclear Magnetic Resonance Spectroscopy Market, By Product
8.1. Nuclear Magnetic Resonance Spectroscopy Market, by Product, 2024-2033
8.1.1 Instruments
8.1.1.1. Market Revenue and Forecast (2021-2033)
8.1.2. Consumables
8.1.2.1. Market Revenue and Forecast (2021-2033)
Chapter 9. Global Nuclear Magnetic Resonance Spectroscopy Market, By Type
9.1. Nuclear Magnetic Resonance Spectroscopy Market, by Type, 2024-2033
9.1.1. Low-field NMR Spectroscopy
9.1.1.1. Market Revenue and Forecast (2021-2033)
9.1.2. High-field NMR Spectroscopy
9.1.2.1. Market Revenue and Forecast (2021-2033)
Chapter 10. Global Nuclear Magnetic Resonance Spectroscopy Market, By End-use
10.1. Nuclear Magnetic Resonance Spectroscopy Market, by End-use, 2024-2033
10.1.1. Academic
10.1.1.1. Market Revenue and Forecast (2021-2033)
10.1.2. Pharmaceutical & Biotech Companies
10.1.2.1. Market Revenue and Forecast (2021-2033)
10.1.3. Agriculture & Food
10.1.3.1. Market Revenue and Forecast (2021-2033)
10.1.4. Chemical Industry
10.1.4.1. Market Revenue and Forecast (2021-2033)
10.1.5. Others
10.1.5.1. Market Revenue and Forecast (2021-2033)
Chapter 11. Global Nuclear Magnetic Resonance Spectroscopy Market, Regional Estimates and Trend Forecast
11.1. North America
11.1.1. Market Revenue and Forecast, by Product (2021-2033)
11.1.2. Market Revenue and Forecast, by Type (2021-2033)
11.1.3. Market Revenue and Forecast, by End-use (2021-2033)
11.1.4. U.S.
11.1.4.1. Market Revenue and Forecast, by Product (2021-2033)
11.1.4.2. Market Revenue and Forecast, by Type (2021-2033)
11.1.4.3. Market Revenue and Forecast, by End-use (2021-2033)
11.1.5. Rest of North America
11.1.5.1. Market Revenue and Forecast, by Product (2021-2033)
11.1.5.2. Market Revenue and Forecast, by Type (2021-2033)
11.1.5.3. Market Revenue and Forecast, by End-use (2021-2033)
11.2. Europe
11.2.1. Market Revenue and Forecast, by Product (2021-2033)
11.2.2. Market Revenue and Forecast, by Type (2021-2033)
11.2.3. Market Revenue and Forecast, by End-use (2021-2033)
11.2.4. UK
11.2.4.1. Market Revenue and Forecast, by Product (2021-2033)
11.2.4.2. Market Revenue and Forecast, by Type (2021-2033)
11.2.4.3. Market Revenue and Forecast, by End-use (2021-2033)
11.2.5. Germany
11.2.5.1. Market Revenue and Forecast, by Product (2021-2033)
11.2.5.2. Market Revenue and Forecast, by Type (2021-2033)
11.2.5.3. Market Revenue and Forecast, by End-use (2021-2033)
11.2.6. France
11.2.6.1. Market Revenue and Forecast, by Product (2021-2033)
11.2.6.2. Market Revenue and Forecast, by Type (2021-2033)
11.2.6.3. Market Revenue and Forecast, by End-use (2021-2033)
11.2.7. Rest of Europe
11.2.7.1. Market Revenue and Forecast, by Product (2021-2033)
11.2.7.2. Market Revenue and Forecast, by Type (2021-2033)
11.2.7.3. Market Revenue and Forecast, by End-use (2021-2033)
11.3. APAC
11.3.1. Market Revenue and Forecast, by Product (2021-2033)
11.3.2. Market Revenue and Forecast, by Type (2021-2033)
11.3.3. Market Revenue and Forecast, by End-use (2021-2033)
11.3.4. India
11.3.4.1. Market Revenue and Forecast, by Product (2021-2033)
11.3.4.2. Market Revenue and Forecast, by Type (2021-2033)
11.3.4.3. Market Revenue and Forecast, by End-use (2021-2033)
11.3.5. China
11.3.5.1. Market Revenue and Forecast, by Product (2021-2033)
11.3.5.2. Market Revenue and Forecast, by Type (2021-2033)
11.3.5.3. Market Revenue and Forecast, by End-use (2021-2033)
11.3.6. Japan
11.3.6.1. Market Revenue and Forecast, by Product (2021-2033)
11.3.6.2. Market Revenue and Forecast, by Type (2021-2033)
11.3.6.3. Market Revenue and Forecast, by End-use (2021-2033)
11.3.7. Rest of APAC
11.3.7.1. Market Revenue and Forecast, by Product (2021-2033)
11.3.7.2. Market Revenue and Forecast, by Type (2021-2033)
11.3.7.3. Market Revenue and Forecast, by End-use (2021-2033)
11.4. MEA
11.4.1. Market Revenue and Forecast, by Product (2021-2033)
11.4.2. Market Revenue and Forecast, by Type (2021-2033)
11.4.3. Market Revenue and Forecast, by End-use (2021-2033)
11.4.4. GCC
11.4.4.1. Market Revenue and Forecast, by Product (2021-2033)
11.4.4.2. Market Revenue and Forecast, by Type (2021-2033)
11.4.4.3. Market Revenue and Forecast, by End-use (2021-2033)
11.4.5. North Africa
11.4.5.1. Market Revenue and Forecast, by Product (2021-2033)
11.4.5.2. Market Revenue and Forecast, by Type (2021-2033)
11.4.5.3. Market Revenue and Forecast, by End-use (2021-2033)
11.4.6. South Africa
11.4.6.1. Market Revenue and Forecast, by Product (2021-2033)
11.4.6.2. Market Revenue and Forecast, by Type (2021-2033)
11.4.6.3. Market Revenue and Forecast, by End-use (2021-2033)
11.4.7. Rest of MEA
11.4.7.1. Market Revenue and Forecast, by Product (2021-2033)
11.4.7.2. Market Revenue and Forecast, by Type (2021-2033)
11.4.7.3. Market Revenue and Forecast, by End-use (2021-2033)
11.5. Latin America
11.5.1. Market Revenue and Forecast, by Product (2021-2033)
11.5.2. Market Revenue and Forecast, by Type (2021-2033)
11.5.3. Market Revenue and Forecast, by End-use (2021-2033)
11.5.4. Brazil
11.5.4.1. Market Revenue and Forecast, by Product (2021-2033)
11.5.4.2. Market Revenue and Forecast, by Type (2021-2033)
11.5.4.3. Market Revenue and Forecast, by End-use (2021-2033)
11.5.5. Rest of LATAM
11.5.5.1. Market Revenue and Forecast, by Product (2021-2033)
11.5.5.2. Market Revenue and Forecast, by Type (2021-2033)
11.5.5.3. Market Revenue and Forecast, by End-use (2021-2033)
Chapter 12. Company Profiles
12.1. JEOL Ltd.
12.1.1. Company Overview
12.1.2. Product Offerings
12.1.3. Financial Performance
12.1.4. Recent Initiatives
12.2. Thermo Fisher Scientific Inc.
12.2.1. Company Overview
12.2.2. Product Offerings
12.2.3. Financial Performance
12.2.4. Recent Initiatives
12.3. Bruker
12.3.1. Company Overview
12.3.2. Product Offerings
12.3.3. Financial Performance
12.3.4. Recent Initiatives
12.4. Magritek
12.4.1. Company Overview
12.4.2. Product Offerings
12.4.3. Financial Performance
12.4.4. Recent Initiatives
12.5. Oxford Instruments
12.5.1. Company Overview
12.5.2. Product Offerings
12.5.3. Financial Performance
12.5.4. Recent Initiatives
12.6. Nanalysis Corp.
12.6.1. Company Overview
12.6.2. Product Offerings
12.6.3. Financial Performance
12.6.4. Recent Initiatives
12.7. Anasazi Instruments, Inc.
12.7.1. Company Overview
12.7.2. Product Offerings
12.7.3. Financial Performance
12.7.4. Recent Initiatives
12.8. QOneTec
12.8.1. Company Overview
12.8.2. Product Offerings
12.8.3. Financial Performance
12.8.4. Recent Initiatives
12.9. Advanced Magnetic Resonance Limited
12.9.1. Company Overview
12.9.2. Product Offerings
12.9.3. Financial Performance
12.9.4. Recent Initiatives
Chapter 13. Research Methodology
13.1. Primary Research
13.2. Secondary Research
13.3. Assumptions
Chapter 14. Appendix
14.1. About Us
14.2. Glossary of Terms
 Cross-segment Market Size and Analysis for
Mentioned Segments
 Additional Company Profiles (Upto 5 With No Cost)
 Additional Countries (Apart From Mentioned Countries)
 Country/Region-specific Report
 Go To Market Strategy
 Region Specific Market Dynamics
 Region Level Market Share
 Import Export Analysis
 Production Analysis
 Others