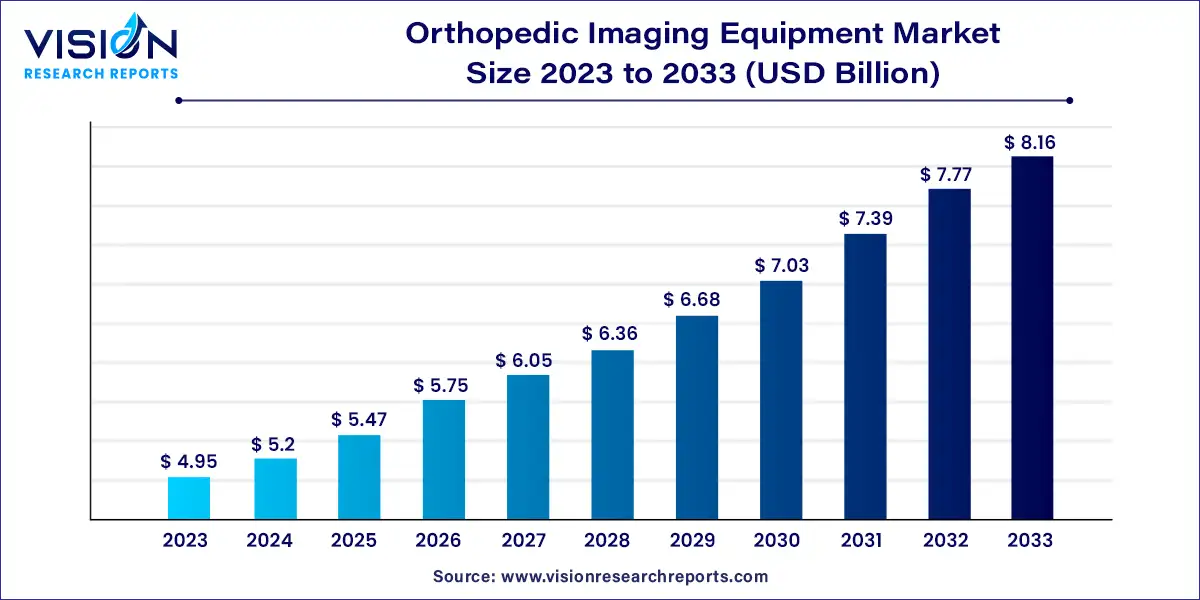
The global orthopedic imaging equipment market size was estimated at around USD 4.95 billion in 2023 and it is projected to hit around USD 8.16 billion by 2033, growing at a CAGR of 5.13% from 2024 to 2033. The orthopedic imaging equipment market is a vital component of the healthcare industry, providing crucial diagnostic tools for the assessment and treatment of musculoskeletal conditions.

The growth of the orthopedic imaging equipment market is propelled by an increasing prevalence of orthopedic disorders, coupled with the aging population worldwide, has led to a growing demand for advanced diagnostic tools to assess musculoskeletal conditions. Additionally, technological advancements in imaging modalities, such as MRI, CT scanners, and ultrasound systems, have significantly enhanced diagnostic accuracy and efficiency, further driving market growth. Moreover, the rising adoption of minimally invasive procedures in orthopedic surgery necessitates the use of sophisticated imaging equipment for precise pre-operative planning and intraoperative guidance. These factors collectively contribute to the robust expansion of the orthopedic imaging equipment market, with sustained innovation and evolving healthcare needs poised to fuel future growth.
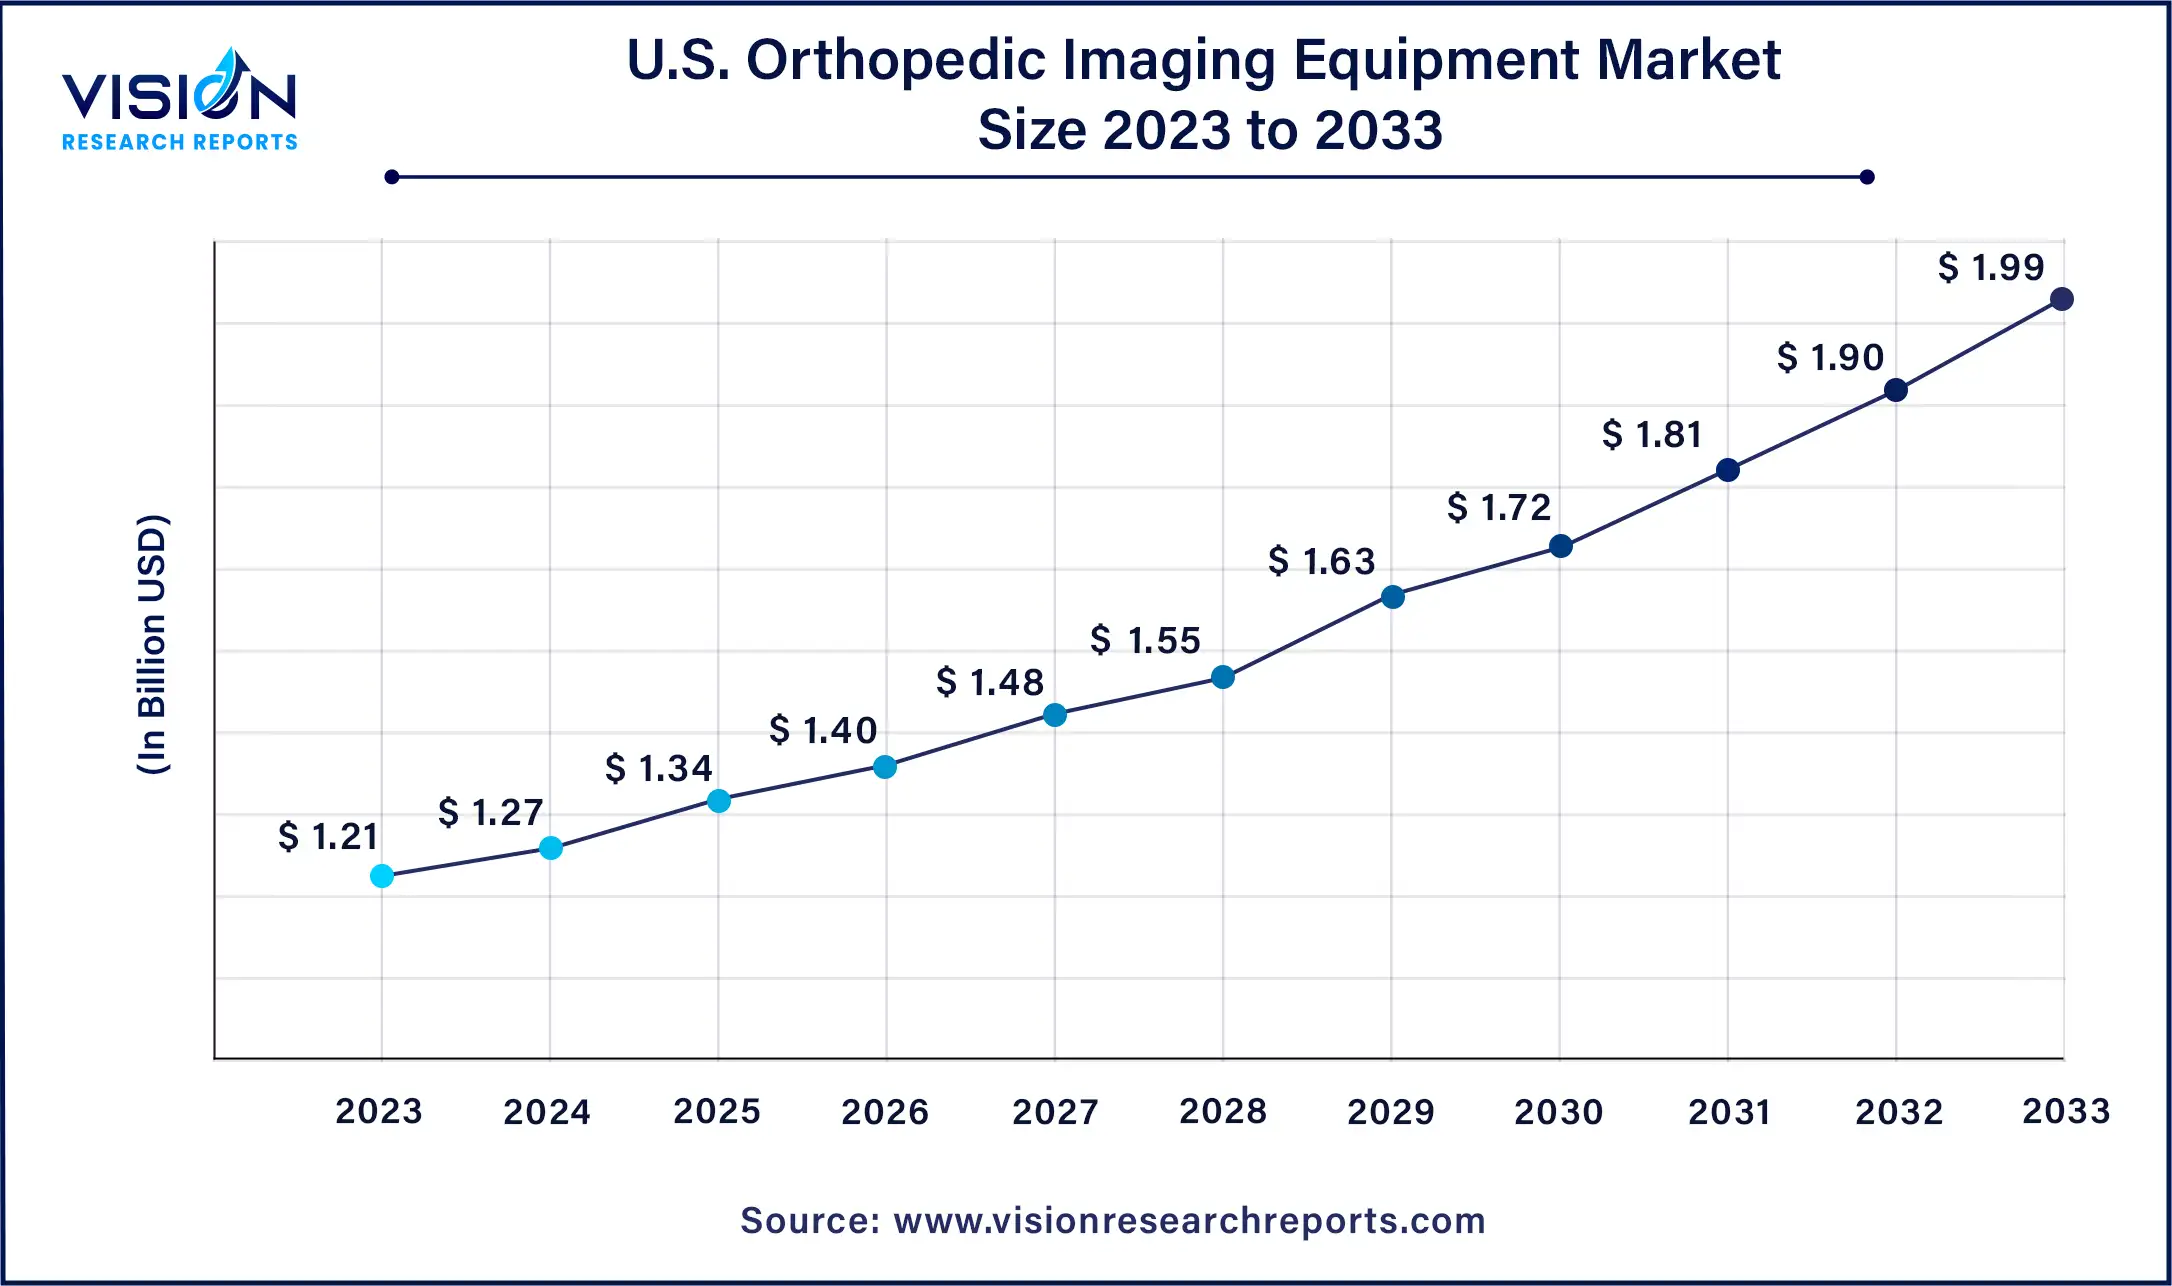
The U.S. orthopedic imaging equipment market size was valued at USD 1.21 billion in 2023 and it is predicted to surpass around USD 1.99 billion by 2033 with a CAGR of 5.11% from 2024 to 2033.

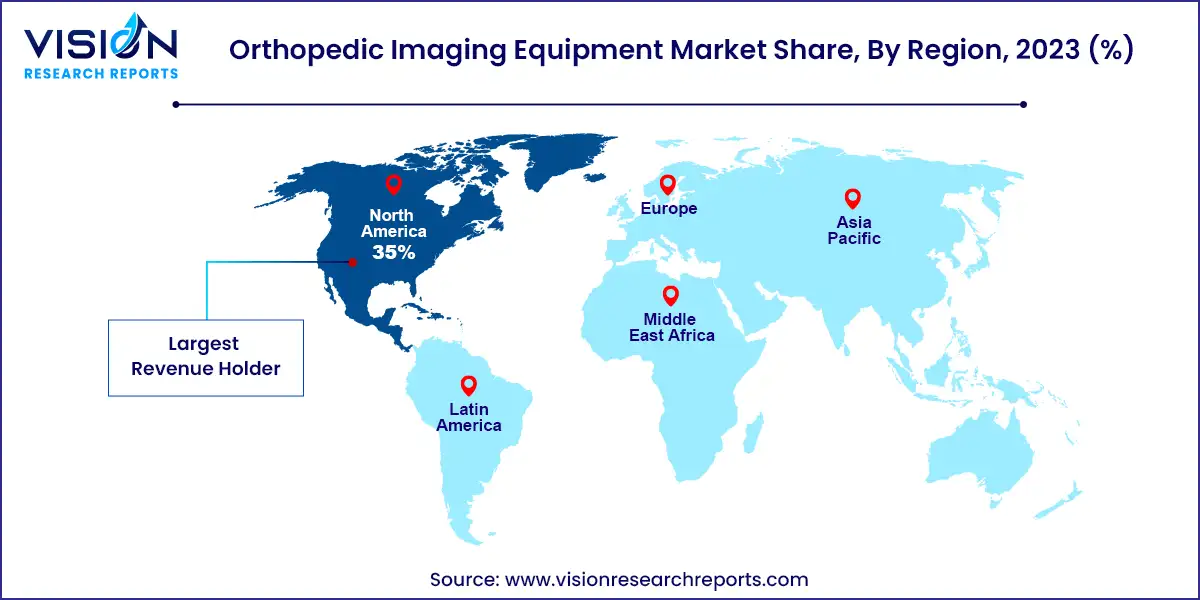
In 2023, the orthopedic imaging equipment market in North America clinched the leading share at 35%. Anticipated technological advancements and a mounting incidence of chronic conditions are poised to propel market expansion throughout the forecast period. Moreover, the widespread adoption of sophisticated imaging modalities for orthopedic applications among end-users is projected to fuel market growth. For instance, in September 2023, UC Davis Health unveiled a specialized clinic focused on musculoskeletal ultrasound, targeting patients grappling with rheumatological conditions.

Meanwhile, the orthopedic imaging equipment market in Asia Pacific is forecasted to witness the swiftest Compound Annual Growth Rate (CAGR) from 2024 to 2033. This surge is attributed to the burgeoning aging population, which is inherently more susceptible to geriatric orthopedic injuries, coupled with a burgeoning demand for state-of-the-art imaging devices.
The X-ray category dominated the market with a significant share of over 33% in 2023. X-rays serve as invaluable diagnostic tools primarily employed to detect diseases and anomalies within bone structures. These encompass degenerative ailments, fractures, dislocations, infections, and tumors. Moreover, they offer a cost-effective and easily accessible imaging solution, readily available in hospitals and clinics. However, X-rays may not always furnish a comprehensive diagnosis for soft tissue injuries such as muscle, tendon, or ligament damage, as their efficacy lies in visualizing bone and dense tissues.
On the other hand, the CT segment is projected to exhibit the highest Compound Annual Growth Rate (CAGR) from 2024 to 2033. CT scans are highly efficient in orthopedic imaging due to their capability to deliver detailed images of bone structures. This proves beneficial in diagnosing intricate fractures or assessing the extent of damage in traumatic cases. Additionally, CT scans can be utilized for image guidance during bone biopsy or joint injection procedures.
In 2023, the trauma cases segment commanded the largest market share, surpassing 21%, driven by the surge in sports injuries and accidents. For example, data from the WHO released in December 2023 revealed that approximately 1.19 million individuals perish annually due to road traffic accidents. Consequently, prompt and accurate diagnosis is imperative for effective treatment, particularly in sports medicine and emergency care contexts. Orthopedic imaging assumes a pivotal role in evaluating injury severity and facilitating crucial interventions. Conversely, the arthritis segment is poised to exhibit the swiftest Compound Annual Growth Rate (CAGR) from 2024 to 2030.
This ascent can be attributed to the escalating prevalence of arthritis and the burgeoning geriatric populace. While arthritis can afflict individuals across all age groups, its incidence notably escalates beyond 45 years of age. The condition can significantly compromise physical well-being owing to the pain and functional constraints it entails. For instance, statistics from the Centers for Disease Control and Prevention indicate that approximately 1 in 5 adults in the US (21.2%), totaling around 53.2 million individuals, received an arthritis diagnosis during the period spanning 2019 to 2021. The accessibility, affordability, and non-invasive nature of orthopedic imaging products constitute key drivers underpinning their demand within this segment.
In 2023, the hospital segment emerged as the dominant force in the orthopedic imaging devices market, commanding a share exceeding 47%. Hospitals stand as the primary choice for patients seeking orthopedic care, be it for chronic ailments or sudden injuries. This preference stems from hospitals' comprehensive capabilities in managing diverse orthopedic cases, facilitated by a plethora of medical services housed under one roof, encompassing emergency departments, surgical suites, and inpatient facilities. Moreover, hospitals boast access to cutting-edge orthopedic imaging equipment, including nuclear imaging, MRI, CT, and X-ray machines, pivotal for both diagnosis and treatment monitoring processes.
Conversely, the diagnostic imaging centers segment is slated to witness substantial growth at a notable Compound Annual Growth Rate (CAGR) from 2024 to 2033. These centers specialize in offering a broad spectrum of imaging modalities, tailored specifically for orthopedic evaluations. Patients gravitate towards radiology centers due to their heightened efficiency, specialized expertise, and shortened appointment waiting periods. This proves particularly advantageous for individuals in pursuit of routine orthopedic assessments or non-emergency diagnostic procedures.
By Modality
By Indication
By End-use
By Region
Chapter 1. Introduction
1.1. Research Objective
1.2. Scope of the Study
1.3. Definition
Chapter 2. Research Methodology
2.1. Research Approach
2.2. Data Sources
2.3. Assumptions & Limitations
Chapter 3. Executive Summary
3.1. Market Snapshot
Chapter 4. Market Variables and Scope
4.1. Introduction
4.2. Market Classification and Scope
4.3. Industry Value Chain Analysis
4.3.1. Raw Material Procurement Analysis
4.3.2. Sales and Distribution Modality Analysis
4.3.3. Downstream Buyer Analysis
Chapter 5. COVID 19 Impact on Orthopedic Imaging Equipment Market
5.1. COVID-19 Landscape: Orthopedic Imaging Equipment Industry Impact
5.2. COVID 19 - Impact Assessment for the Industry
5.3. COVID 19 Impact: Global Major Government Policy
5.4. Market Trends and Opportunities in the COVID-19 Landscape
Chapter 6. Market Dynamics Analysis and Trends
6.1. Market Dynamics
6.1.1. Market Drivers
6.1.2. Market Restraints
6.1.3. Market Opportunities
6.2. Porter’s Five Forces Analysis
6.2.1. Bargaining power of suppliers
6.2.2. Bargaining power of buyers
6.2.3. Threat of substitute
6.2.4. Threat of new entrants
6.2.5. Degree of competition
Chapter 7. Competitive Landscape
7.1.1. Company Market Share/Positioning Analysis
7.1.2. Key Strategies Adopted by Players
7.1.3. Vendor Landscape
7.1.3.1. List of Suppliers
7.1.3.2. List of Buyers
Chapter 8. Global Orthopedic Imaging Equipment Market, By Modality
8.1. Orthopedic Imaging Equipment Market, by Modality, 2024-2033
8.1.1 X-ray
8.1.1.1. Market Revenue and Forecast (2021-2033)
8.1.2. CT
8.1.2.1. Market Revenue and Forecast (2021-2033)
8.1.3. MRI
8.1.3.1. Market Revenue and Forecast (2021-2033)
8.1.4. Ultrasound
8.1.4.1. Market Revenue and Forecast (2021-2033)
8.1.5. Nuclear Imaging
8.1.5.1. Market Revenue and Forecast (2021-2033)
Chapter 9. Global Orthopedic Imaging Equipment Market, By Indication
9.1. Orthopedic Imaging Equipment Market, by Indication, 2024-2033
9.1.1. Trauma Cases
9.1.1.1. Market Revenue and Forecast (2021-2033)
9.1.2. Sport Injuries
9.1.2.1. Market Revenue and Forecast (2021-2033)
9.1.3. Spinal Injuries
9.1.3.1. Market Revenue and Forecast (2021-2033)
9.1.4. Arthritis
9.1.4.1. Market Revenue and Forecast (2021-2033)
9.1.5. Bone Disorders
9.1.5.1. Market Revenue and Forecast (2021-2033)
9.1.6. Musculoskeletal Cancer
9.1.6.1. Market Revenue and Forecast (2021-2033)
9.1.7. Muscle Atrophy
9.1.7.1. Market Revenue and Forecast (2021-2033)
9.1.8. Others
9.1.8.1. Market Revenue and Forecast (2021-2033)
Chapter 10. Global Orthopedic Imaging Equipment Market, By End-use
10.1. Orthopedic Imaging Equipment Market, by End-use, 2024-2033
10.1.1. Hospitals
10.1.1.1. Market Revenue and Forecast (2021-2033)
10.1.2. Diagnostic Imaging Centers
10.1.2.1. Market Revenue and Forecast (2021-2033)
10.1.3. Others
10.1.3.1. Market Revenue and Forecast (2021-2033)
Chapter 11. Global Orthopedic Imaging Equipment Market, Regional Estimates and Trend Forecast
11.1. North America
11.1.1. Market Revenue and Forecast, by Modality (2021-2033)
11.1.2. Market Revenue and Forecast, by Indication (2021-2033)
11.1.3. Market Revenue and Forecast, by End-use (2021-2033)
11.1.4. U.S.
11.1.4.1. Market Revenue and Forecast, by Modality (2021-2033)
11.1.4.2. Market Revenue and Forecast, by Indication (2021-2033)
11.1.4.3. Market Revenue and Forecast, by End-use (2021-2033)
11.1.5. Rest of North America
11.1.5.1. Market Revenue and Forecast, by Modality (2021-2033)
11.1.5.2. Market Revenue and Forecast, by Indication (2021-2033)
11.1.5.3. Market Revenue and Forecast, by End-use (2021-2033)
11.2. Europe
11.2.1. Market Revenue and Forecast, by Modality (2021-2033)
11.2.2. Market Revenue and Forecast, by Indication (2021-2033)
11.2.3. Market Revenue and Forecast, by End-use (2021-2033)
11.2.4. UK
11.2.4.1. Market Revenue and Forecast, by Modality (2021-2033)
11.2.4.2. Market Revenue and Forecast, by Indication (2021-2033)
11.2.4.3. Market Revenue and Forecast, by End-use (2021-2033)
11.2.5. Germany
11.2.5.1. Market Revenue and Forecast, by Modality (2021-2033)
11.2.5.2. Market Revenue and Forecast, by Indication (2021-2033)
11.2.5.3. Market Revenue and Forecast, by End-use (2021-2033)
11.2.6. France
11.2.6.1. Market Revenue and Forecast, by Modality (2021-2033)
11.2.6.2. Market Revenue and Forecast, by Indication (2021-2033)
11.2.6.3. Market Revenue and Forecast, by End-use (2021-2033)
11.2.7. Rest of Europe
11.2.7.1. Market Revenue and Forecast, by Modality (2021-2033)
11.2.7.2. Market Revenue and Forecast, by Indication (2021-2033)
11.2.7.3. Market Revenue and Forecast, by End-use (2021-2033)
11.3. APAC
11.3.1. Market Revenue and Forecast, by Modality (2021-2033)
11.3.2. Market Revenue and Forecast, by Indication (2021-2033)
11.3.3. Market Revenue and Forecast, by End-use (2021-2033)
11.3.4. India
11.3.4.1. Market Revenue and Forecast, by Modality (2021-2033)
11.3.4.2. Market Revenue and Forecast, by Indication (2021-2033)
11.3.4.3. Market Revenue and Forecast, by End-use (2021-2033)
11.3.5. China
11.3.5.1. Market Revenue and Forecast, by Modality (2021-2033)
11.3.5.2. Market Revenue and Forecast, by Indication (2021-2033)
11.3.5.3. Market Revenue and Forecast, by End-use (2021-2033)
11.3.6. Japan
11.3.6.1. Market Revenue and Forecast, by Modality (2021-2033)
11.3.6.2. Market Revenue and Forecast, by Indication (2021-2033)
11.3.6.3. Market Revenue and Forecast, by End-use (2021-2033)
11.3.7. Rest of APAC
11.3.7.1. Market Revenue and Forecast, by Modality (2021-2033)
11.3.7.2. Market Revenue and Forecast, by Indication (2021-2033)
11.3.7.3. Market Revenue and Forecast, by End-use (2021-2033)
11.4. MEA
11.4.1. Market Revenue and Forecast, by Modality (2021-2033)
11.4.2. Market Revenue and Forecast, by Indication (2021-2033)
11.4.3. Market Revenue and Forecast, by End-use (2021-2033)
11.4.4. GCC
11.4.4.1. Market Revenue and Forecast, by Modality (2021-2033)
11.4.4.2. Market Revenue and Forecast, by Indication (2021-2033)
11.4.4.3. Market Revenue and Forecast, by End-use (2021-2033)
11.4.5. North Africa
11.4.5.1. Market Revenue and Forecast, by Modality (2021-2033)
11.4.5.2. Market Revenue and Forecast, by Indication (2021-2033)
11.4.5.3. Market Revenue and Forecast, by End-use (2021-2033)
11.4.6. South Africa
11.4.6.1. Market Revenue and Forecast, by Modality (2021-2033)
11.4.6.2. Market Revenue and Forecast, by Indication (2021-2033)
11.4.6.3. Market Revenue and Forecast, by End-use (2021-2033)
11.4.7. Rest of MEA
11.4.7.1. Market Revenue and Forecast, by Modality (2021-2033)
11.4.7.2. Market Revenue and Forecast, by Indication (2021-2033)
11.4.7.3. Market Revenue and Forecast, by End-use (2021-2033)
11.5. Latin America
11.5.1. Market Revenue and Forecast, by Modality (2021-2033)
11.5.2. Market Revenue and Forecast, by Indication (2021-2033)
11.5.3. Market Revenue and Forecast, by End-use (2021-2033)
11.5.4. Brazil
11.5.4.1. Market Revenue and Forecast, by Modality (2021-2033)
11.5.4.2. Market Revenue and Forecast, by Indication (2021-2033)
11.5.4.3. Market Revenue and Forecast, by End-use (2021-2033)
11.5.5. Rest of LATAM
11.5.5.1. Market Revenue and Forecast, by Modality (2021-2033)
11.5.5.2. Market Revenue and Forecast, by Indication (2021-2033)
11.5.5.3. Market Revenue and Forecast, by End-use (2021-2033)
Chapter 12. Company Profiles
12.1. GE Healthcare.
12.1.1. Company Overview
12.1.2. Product Offerings
12.1.3. Financial Performance
12.1.4. Recent Initiatives
12.2. Philips Healthcare.
12.2.1. Company Overview
12.2.2. Product Offerings
12.2.3. Financial Performance
12.2.4. Recent Initiatives
12.3. Siemens Healthineers.
12.3.1. Company Overview
12.3.2. Product Offerings
12.3.3. Financial Performance
12.3.4. Recent Initiatives
12.4. Canon Medical Systems Corporation.
12.4.1. Company Overview
12.4.2. Product Offerings
12.4.3. Financial Performance
12.4.4. Recent Initiatives
12.5. Fujifilm Healthcare Solutions.
12.5.1. Company Overview
12.5.2. Product Offerings
12.5.3. Financial Performance
12.5.4. Recent Initiatives
12.6. Esaote
12.6.1. Company Overview
12.6.2. Product Offerings
12.6.3. Financial Performance
12.6.4. Recent Initiatives
12.7. Carestream Health.
12.7.1. Company Overview
12.7.2. Product Offerings
12.7.3. Financial Performance
12.7.4. Recent Initiatives
12.8. Shenzhen Mindray Bio-Medical Electronics Co., Ltd.
12.8.1. Company Overview
12.8.2. Product Offerings
12.8.3. Financial Performance
12.8.4. Recent Initiatives
12.9. United Imaging Healthcare Co.
12.9.1. Company Overview
12.9.2. Product Offerings
12.9.3. Financial Performance
12.9.4. Recent Initiatives
12.10. Shimadzu Corporation
12.10.1. Company Overview
12.10.2. Product Offerings
12.10.3. Financial Performance
12.10.4. Recent Initiatives
Chapter 13. Research Methodology
13.1. Primary Research
13.2. Secondary Research
13.3. Assumptions
Chapter 14. Appendix
14.1. About Us
14.2. Glossary of Terms
 Cross-segment Market Size and Analysis for
Mentioned Segments
 Additional Company Profiles (Upto 5 With No Cost)
 Additional Countries (Apart From Mentioned Countries)
 Country/Region-specific Report
 Go To Market Strategy
 Region Specific Market Dynamics
 Region Level Market Share
 Import Export Analysis
 Production Analysis
 Others