Power over Ethernet (PoE) Chipset Market Size, Share | Report 2023-2032
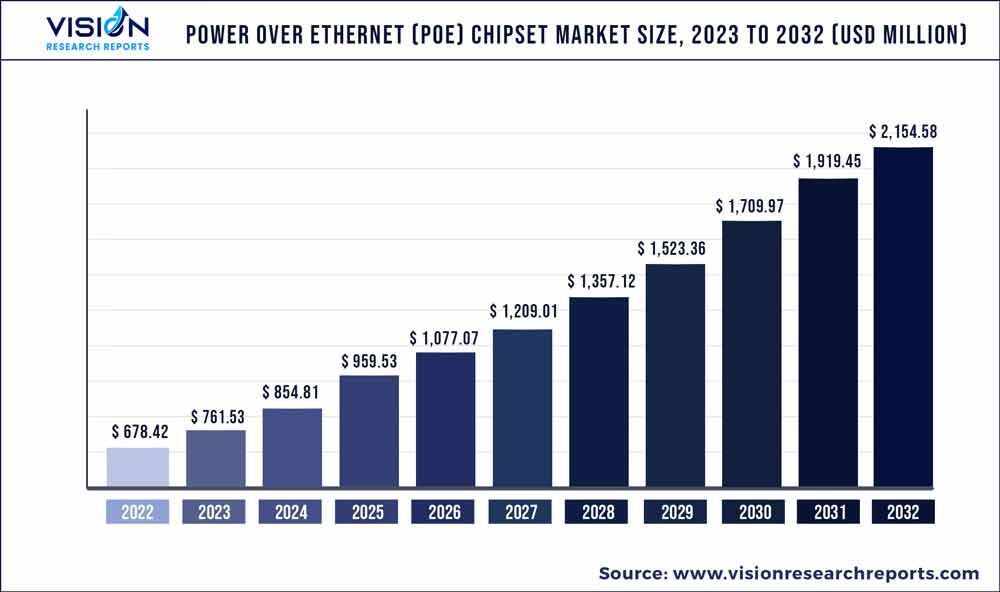
The global power over ethernet (PoE) chipset market was surpassed at USD 678.42 million in 2022 and is expected to hit around USD 2,154.58 million by 2032, growing at a CAGR of 12.25% from 2023 to 2032.
Key Pointers
Report Scope of the Power over Ethernet (PoE) Chipset Market
| Report Coverage | Details |
| Market Size in 2022 | USD 678.42 million |
| Revenue Forecast by 2032 | USD 2,154.58 million |
| Growth rate from 2023 to 2032 | CAGR of 12.25% |
| Base Year | 2022 |
| Forecast Period | 2023 to 2032 |
| Market Analysis (Terms Used) | Value (US$ Million/Billion) or (Volume/Units) |
| Regions Covered | North America, Europe, Asia Pacific, Latin America, Middle East & Africa |
| Companies Covered | Analog Devices, Inc.; Cisco Systems Inc.; Microsemi Corporation (Microchip Technology Inc.); Monolithic Power Systems Inc.; NXP Semiconductors N.V.; On Semiconductor Corporation; Semtech Corporation; Silicon Laboratories Inc.; STMicroelectronics N.V.; Texas Instruments Incorporated |
Rising applications of Power over Ethernet (PoE) chipsets in the residential sector, for example, in webcams & closed-circuit televisions (CCTVs), IP telephones, and complete wireless local area network (WLAN) coverage are poised to stoke the growth of the market over the forecast period.
The key benefit of PoE is that it can transmit both network connectivity and power supply over a single cable and overcomes the need for installing separate wires. Similarly, VoIP phones allow the transmission of mobile signals over a data network. This has led to increased adoption of POE-powered VoIP systems in various industries, including healthcare, finance, and government.
Rising awareness regarding these merits is projected to support the market's growth. Moreover, the growing need for wireless connectivity in various applications, such as corporate offices, hospitals, and educational institutions, drives the demand for POE-powered wireless access points. POE technology enables the deployment of wireless access points without the need for separate power sources, making installation and maintenance easier.
Growing IT developments in the education and healthcare sectors are leading to an increase in the deployment of PoE chipset technology in the commercial sector. Enhanced applications of technology such as smart meters use Ethernet technology for benefits such as energy efficiency, improved comfort, convenience, and security. The increasing number of installations of smart meters is anticipated to drive the Power over the Ethernet market over the forecast period. Surging demand for better network access and minimum disruption and the cost is leading to an increase in installations of PoE chipsets in various businesses.
Various technological advancements, including the development of advanced POE chipsets with higher power capacity and better performance, are driving the growth of the market. These chipsets offer better reliability, flexibility, and efficiency, enabling deploying more complex and sophisticated POE-powered devices and systems.
Moreover, The Industrial Internet-of-Things (IIoT) and Internet of Things (IoT) are increasingly used in smart buildings, automated factories, and industrial networks, generating a positive outlook for the market. Significant infrastructure improvements, particularly in emerging countries, along with the use of big data analytics and cloud-based services, are likely to further fuel the market’s growth.
Type Insights
The PoE Powered Devices (PD) chipset segment dominates the market with a revenue share of 54.72% in 2022. There is a growing trend towards the miniaturization of PoE PDs, as manufacturers look to reduce the size and weight of PoE-enabled devices. This trend is driven by the growing demand for compact and lightweight PoE-enabled devices, such as IP cameras and access control devices.
Furthermore, PoE PDs are increasingly consuming higher power levels to support more advanced features and functions. For example, high-end IP cameras may require up to 60 watts of power, while PoE-powered LED lighting systems may require up to 100 watts of power. PoE injector eliminates the need for installing separate electrical cables to provide a power source. Increasing implementation of VoIP devices in telecommunication applications due to their cost-effectiveness is estimated to further augment the market over the forecast period.
The PSE segment is projected to grow over the forecasted period. The factor attributed to the market growth is the growing demand for PoE PSEs that can deliver higher power levels to support the increasing power requirements of PoE-enabled devices.
The latest PoE standards, such as IEEE 802.3bt, support up to 90 watts of power, and PoE PSEs are being developed to support these higher power levels. PSE chipsets support various levels of PoE and linear technology standards. These devices are solely responsible for detecting and classifying powered devices, along with providing the right amount of energy to said devices through Ethernet cables.
Standard Insights
The 802.3at standard segment dominates the market with a revenue share of 48.33% in 2022. The 802.3at, also known as PoE Plus, is an advanced version of PoE. It can deliver around 34.2 W of power to powered devices. The scope of applications of Ethernet cable is widening, which is expected to further contribute to the growth of the market. The adoption of PoE technology is increasing in various applications, such as smart buildings, industrial automation, and healthcare. This has led to an increase in demand for PoE chipsets that can provide power to a wide range of devices.
IEEE 802.3bt is a next-generation PoE standard that is likely to be implemented by 2018. It delivers ultra-high power of up to a range of 60 to 90 watts. It can support devices such as video-conferencing device components and building management devices, point of sale (PoS) devices, and digital signage devices. Power over Ethernet chipsets are now being integrated with advanced features such as intelligent power management, thermal protection, and remote monitoring. This has made PoE chipsets more versatile and has led to an increase in demand for these chipsets.
Device Insights
The ethernet switch & injector phone segment dominates the market with a revenue share of 25.21% in 2022. The factor attributed to the growth is the increasing demand for networked devices and the need for efficient power delivery. Increasing deployment of cameras, proximity sensors, and RFID readers for network security purposes in residential applications is projected to boost the demand for PoE chipsets.
Spiraling applications of security systems, IP cameras in VoIP, and webcams are anticipated to propel the market. Surging demand for PoE-based products in commercial buildings, especially for connectivity applications, and security & access control, is estimated to positively influence the overall market.
The LED lighting segment is expected to grow the fastest CAGR from 2023 to 2032. The rising adoption of LED light and the growing integration of PoE in LED lighting technology are anticipated to augment the market over the forecast period. The adoption of LED lighting solutions is increasing due to their energy efficiency, longer lifespan, and cost-effectiveness compared to traditional lighting systems.
This trend is leading to a rise in demand for PoE-enabled LED lighting solutions that could be powered and controlled through the Ethernet network, simplifying installation and reducing energy consumption. Moreover, the increasing focus on sustainability and energy efficiency was also contributing to the growth of the PoE-enabled LED lighting segment.
End-use Insights
The industrial segment led the market with a revenue share of 44.86% in 2022. With the growing need for faster and more reliable communication in industrial automation and control systems, industrial Ethernet is becoming increasingly popular. PoE technology provides a cost-effective and efficient way to power and connects industrial Ethernet devices, such as switches and routers, in harsh environments.
Moreover, the industrial lighting market is also adopting PoE technology to power and control LED lighting systems. The segment is expected to continue to grow, driven by the increasing adoption of PoE-enabled devices in industrial automation and control systems. As more devices become PoE-enabled, the demand for PoE chipsets is expected to increase, driving further growth in the PoE chipset market.
The commercial segment is further classified into office buildings and small offices, retail, healthcare, and hospitality. The smart building market is rapidly adopting PoE technology to power and connect a wide range of devices, including lighting systems, HVAC systems, security systems, and other building automation systems.
PoE technology provides a cost-effective and efficient way to manage and control these systems, improving energy efficiency and reducing operating costs. Increasing penetration of PoE technologies in offices, hospitals, and hotels is likely to contribute to the growth of this end-user segment. Rising awareness regarding the benefits of PoE in lighting and connectivity solutions is projected to stir up the growth of the residential segment.
Regional Insights
North America dominated the market with a revenue share of 38.02% in 2022. North America is the largest market for PoE chipsets, driven by the high adoption of PoE-enabled devices in the region. The trend is expected to continue, driven by the increasing demand for PoE-enabled devices in smart buildings and industrial automation applications.
Moreover, the soaring use of high-speed internet is expected to bolster the demand for Power over Ethernet (PoE) chipsets across the region. Additionally, favorable regulatory frameworks in the European Union are projected to play a crucial role in the growth of the regional market. European countries such as the U.K., Spain, and France are anticipated to register a higher CAGR than other countries in the region over the forecast period.
The Asia Pacific region is expected to grow with the fastest CAGR of 16.46% from 2023 to 2032. The regional market is likely to witness a significant gain in revenue share over the forecast period, based on the growing demand for high-speed internet and the rising trend of automation across various industries in the region.
The trend is expected to continue, driven by the increasing demand for PoE-enabled devices in smart cities and industrial automation applications. Moreover, Japan, China, India, Singapore, and Hong Kong are expected to be the key contributors to the growth of the upcoming 802.3bt standard in the region.
Power over Ethernet (PoE) Chipset Market Segmentations:
By Type
By Standard
By End-use
By Device
By Regional
Chapter 1. Introduction
1.1. Research Objective
1.2. Scope of the Study
1.3. Definition
Chapter 2. Research Methodology
2.1. Research Approach
2.2. Data Sources
2.3. Assumptions & Limitations
Chapter 3. Executive Summary
3.1. Market Snapshot
Chapter 4. Market Variables and Scope
4.1. Introduction
4.2. Market Classification and Scope
4.3. Industry Value Chain Analysis
4.3.1. Raw Material Procurement Analysis
4.3.2. Sales and Distribution Channel Analysis
4.3.3. Downstream Buyer Analysis
Chapter 5. COVID 19 Impact on Power over Ethernet (PoE) Chipset Market
5.1. COVID-19 Landscape: Power over Ethernet (PoE) Chipset Industry Impact
5.2. COVID 19 - Impact Assessment for the Industry
5.3. COVID 19 Impact: Global Major Government Policy
5.4. Market Trends and Opportunities in the COVID-19 Landscape
Chapter 6. Market Dynamics Analysis and Trends
6.1. Market Dynamics
6.1.1. Market Drivers
6.1.2. Market Restraints
6.1.3. Market Opportunities
6.2. Porter’s Five Forces Analysis
6.2.1. Bargaining power of suppliers
6.2.2. Bargaining power of buyers
6.2.3. Threat of substitute
6.2.4. Threat of new entrants
6.2.5. Degree of competition
Chapter 7. Competitive Landscape
7.1.1. Company Market Share/Positioning Analysis
7.1.2. Key Strategies Adopted by Players
7.1.3. Vendor Landscape
7.1.3.1. List of Suppliers
7.1.3.2. List of Buyers
Chapter 8. Global Power over Ethernet (PoE) Chipset Market, By Type
8.1. Power over Ethernet (PoE) Chipset Market, by Type, 2023-2032
8.1.1. PoE Power Sourcing Equipment (PSE) Chipset
8.1.1.1. Market Revenue and Forecast (2020-2032)
8.1.2. PoE Powered Devices (PD) Chipset
8.1.2.1. Market Revenue and Forecast (2020-2032)
Chapter 9. Global Power over Ethernet (PoE) Chipset Market, By Standard
9.1. Power over Ethernet (PoE) Chipset Market, by Standard, 2023-2032
9.1.1. 802.3af standard
9.1.1.1. Market Revenue and Forecast (2020-2032)
9.1.2. 802.3at standard
9.1.2.1. Market Revenue and Forecast (2020-2032)
9.1.3. 802.3bt standard
9.1.3.1. Market Revenue and Forecast (2020-2032)
Chapter 10. Global Power over Ethernet (PoE) Chipset Market, By End-use
10.1. Power over Ethernet (PoE) Chipset Market, by End-use, 2023-2032
10.1.1. Commercial
10.1.1.1. Market Revenue and Forecast (2020-2032)
10.1.2. Industrial
10.1.2.1. Market Revenue and Forecast (2020-2032)
10.1.3. Residential
10.1.3.1. Market Revenue and Forecast (2020-2032)
Chapter 11. Global Power over Ethernet (PoE) Chipset Market, By Device
11.1. Power over Ethernet (PoE) Chipset Market, by Device, 2023-2032
11.1.1. Network Cameras
11.1.1.1. Market Revenue and Forecast (2020-2032)
11.1.2. VoIP Phone
11.1.2.1. Market Revenue and Forecast (2020-2032)
11.1.3. Ethernet Switch & Injector
11.1.3.1. Market Revenue and Forecast (2020-2032)
11.1.4. Wireless Radio Access Point
11.1.4.1. Market Revenue and Forecast (2020-2032)
11.1.5. Proximity Sensor
11.1.5.1. Market Revenue and Forecast (2020-2032)
11.1.6. LED Lighting
11.1.6.1. Market Revenue and Forecast (2020-2032)
Chapter 12. Global Power over Ethernet (PoE) Chipset Market, Regional Estimates and Trend Forecast
12.1. North America
12.1.1. Market Revenue and Forecast, by Type (2020-2032)
12.1.2. Market Revenue and Forecast, by Standard (2020-2032)
12.1.3. Market Revenue and Forecast, by End-use (2020-2032)
12.1.4. Market Revenue and Forecast, by Device (2020-2032)
12.1.5. U.S.
12.1.5.1. Market Revenue and Forecast, by Type (2020-2032)
12.1.5.2. Market Revenue and Forecast, by Standard (2020-2032)
12.1.5.3. Market Revenue and Forecast, by End-use (2020-2032)
12.1.5.4. Market Revenue and Forecast, by Device (2020-2032)
12.1.6. Rest of North America
12.1.6.1. Market Revenue and Forecast, by Type (2020-2032)
12.1.6.2. Market Revenue and Forecast, by Standard (2020-2032)
12.1.6.3. Market Revenue and Forecast, by End-use (2020-2032)
12.1.6.4. Market Revenue and Forecast, by Device (2020-2032)
12.2. Europe
12.2.1. Market Revenue and Forecast, by Type (2020-2032)
12.2.2. Market Revenue and Forecast, by Standard (2020-2032)
12.2.3. Market Revenue and Forecast, by End-use (2020-2032)
12.2.4. Market Revenue and Forecast, by Device (2020-2032)
12.2.5. UK
12.2.5.1. Market Revenue and Forecast, by Type (2020-2032)
12.2.5.2. Market Revenue and Forecast, by Standard (2020-2032)
12.2.5.3. Market Revenue and Forecast, by End-use (2020-2032)
12.2.5.4. Market Revenue and Forecast, by Device (2020-2032)
12.2.6. Germany
12.2.6.1. Market Revenue and Forecast, by Type (2020-2032)
12.2.6.2. Market Revenue and Forecast, by Standard (2020-2032)
12.2.6.3. Market Revenue and Forecast, by End-use (2020-2032)
12.2.6.4. Market Revenue and Forecast, by Device (2020-2032)
12.2.7. France
12.2.7.1. Market Revenue and Forecast, by Type (2020-2032)
12.2.7.2. Market Revenue and Forecast, by Standard (2020-2032)
12.2.7.3. Market Revenue and Forecast, by End-use (2020-2032)
12.2.7.4. Market Revenue and Forecast, by Device (2020-2032)
12.2.8. Rest of Europe
12.2.8.1. Market Revenue and Forecast, by Type (2020-2032)
12.2.8.2. Market Revenue and Forecast, by Standard (2020-2032)
12.2.8.3. Market Revenue and Forecast, by End-use (2020-2032)
12.2.8.4. Market Revenue and Forecast, by Device (2020-2032)
12.3. APAC
12.3.1. Market Revenue and Forecast, by Type (2020-2032)
12.3.2. Market Revenue and Forecast, by Standard (2020-2032)
12.3.3. Market Revenue and Forecast, by End-use (2020-2032)
12.3.4. Market Revenue and Forecast, by Device (2020-2032)
12.3.5. India
12.3.5.1. Market Revenue and Forecast, by Type (2020-2032)
12.3.5.2. Market Revenue and Forecast, by Standard (2020-2032)
12.3.5.3. Market Revenue and Forecast, by End-use (2020-2032)
12.3.5.4. Market Revenue and Forecast, by Device (2020-2032)
12.3.6. China
12.3.6.1. Market Revenue and Forecast, by Type (2020-2032)
12.3.6.2. Market Revenue and Forecast, by Standard (2020-2032)
12.3.6.3. Market Revenue and Forecast, by End-use (2020-2032)
12.3.6.4. Market Revenue and Forecast, by Device (2020-2032)
12.3.7. Japan
12.3.7.1. Market Revenue and Forecast, by Type (2020-2032)
12.3.7.2. Market Revenue and Forecast, by Standard (2020-2032)
12.3.7.3. Market Revenue and Forecast, by End-use (2020-2032)
12.3.7.4. Market Revenue and Forecast, by Device (2020-2032)
12.3.8. Rest of APAC
12.3.8.1. Market Revenue and Forecast, by Type (2020-2032)
12.3.8.2. Market Revenue and Forecast, by Standard (2020-2032)
12.3.8.3. Market Revenue and Forecast, by End-use (2020-2032)
12.3.8.4. Market Revenue and Forecast, by Device (2020-2032)
12.4. MEA
12.4.1. Market Revenue and Forecast, by Type (2020-2032)
12.4.2. Market Revenue and Forecast, by Standard (2020-2032)
12.4.3. Market Revenue and Forecast, by End-use (2020-2032)
12.4.4. Market Revenue and Forecast, by Device (2020-2032)
12.4.5. GCC
12.4.5.1. Market Revenue and Forecast, by Type (2020-2032)
12.4.5.2. Market Revenue and Forecast, by Standard (2020-2032)
12.4.5.3. Market Revenue and Forecast, by End-use (2020-2032)
12.4.5.4. Market Revenue and Forecast, by Device (2020-2032)
12.4.6. North Africa
12.4.6.1. Market Revenue and Forecast, by Type (2020-2032)
12.4.6.2. Market Revenue and Forecast, by Standard (2020-2032)
12.4.6.3. Market Revenue and Forecast, by End-use (2020-2032)
12.4.6.4. Market Revenue and Forecast, by Device (2020-2032)
12.4.7. South Africa
12.4.7.1. Market Revenue and Forecast, by Type (2020-2032)
12.4.7.2. Market Revenue and Forecast, by Standard (2020-2032)
12.4.7.3. Market Revenue and Forecast, by End-use (2020-2032)
12.4.7.4. Market Revenue and Forecast, by Device (2020-2032)
12.4.8. Rest of MEA
12.4.8.1. Market Revenue and Forecast, by Type (2020-2032)
12.4.8.2. Market Revenue and Forecast, by Standard (2020-2032)
12.4.8.3. Market Revenue and Forecast, by End-use (2020-2032)
12.4.8.4. Market Revenue and Forecast, by Device (2020-2032)
12.5. Latin America
12.5.1. Market Revenue and Forecast, by Type (2020-2032)
12.5.2. Market Revenue and Forecast, by Standard (2020-2032)
12.5.3. Market Revenue and Forecast, by End-use (2020-2032)
12.5.4. Market Revenue and Forecast, by Device (2020-2032)
12.5.5. Brazil
12.5.5.1. Market Revenue and Forecast, by Type (2020-2032)
12.5.5.2. Market Revenue and Forecast, by Standard (2020-2032)
12.5.5.3. Market Revenue and Forecast, by End-use (2020-2032)
12.5.5.4. Market Revenue and Forecast, by Device (2020-2032)
12.5.6. Rest of LATAM
12.5.6.1. Market Revenue and Forecast, by Type (2020-2032)
12.5.6.2. Market Revenue and Forecast, by Standard (2020-2032)
12.5.6.3. Market Revenue and Forecast, by End-use (2020-2032)
12.5.6.4. Market Revenue and Forecast, by Device (2020-2032)
Chapter 13. Company Profiles
13.1. Analog Devices, Inc.
13.1.1. Company Overview
13.1.2. Product Offerings
13.1.3. Financial Performance
13.1.4. Recent Initiatives
13.2. Cisco Systems Inc.
13.2.1. Company Overview
13.2.2. Product Offerings
13.2.3. Financial Performance
13.2.4. Recent Initiatives
13.3. Microsemi Corporation (Microchip Technology Inc.)
13.3.1. Company Overview
13.3.2. Product Offerings
13.3.3. Financial Performance
13.3.4. Recent Initiatives
13.4. Monolithic Power Systems Inc.
13.4.1. Company Overview
13.4.2. Product Offerings
13.4.3. Financial Performance
13.4.4. Recent Initiatives
13.5. NXP Semiconductors N.V.
13.5.1. Company Overview
13.5.2. Product Offerings
13.5.3. Financial Performance
13.5.4. Recent Initiatives
13.6. On Semiconductor Corporation
13.6.1. Company Overview
13.6.2. Product Offerings
13.6.3. Financial Performance
13.6.4. Recent Initiatives
13.7. Semtech Corporation
13.7.1. Company Overview
13.7.2. Product Offerings
13.7.3. Financial Performance
13.7.4. Recent Initiatives
13.8. Silicon Laboratories Inc.
13.8.1. Company Overview
13.8.2. Product Offerings
13.8.3. Financial Performance
13.8.4. Recent Initiatives
13.9. STMicroelectronics N.V.
13.9.1. Company Overview
13.9.2. Product Offerings
13.9.3. Financial Performance
13.9.4. Recent Initiatives
13.10. Texas Instruments Incorporated
13.10.1. Company Overview
13.10.2. Product Offerings
13.10.3. Financial Performance
13.10.4. Recent Initiatives
Chapter 14. Research Methodology
14.1. Primary Research
14.2. Secondary Research
14.3. Assumptions
Chapter 15. Appendix
15.1. About Us
15.2. Glossary of Terms
 Cross-segment Market Size and Analysis for
Mentioned Segments
Additional Company Profiles (Upto 5 With No Cost)
Additional Countries (Apart From Mentioned Countries)
Country/Region-specific Report
Go To Market Strategy
Region Specific Market DynamicsRegion Level Market Share Import Export AnalysisProduction AnalysisOthers
Cross-segment Market Size and Analysis for
Mentioned Segments
Additional Company Profiles (Upto 5 With No Cost)
Additional Countries (Apart From Mentioned Countries)
Country/Region-specific Report
Go To Market Strategy
Region Specific Market DynamicsRegion Level Market Share Import Export AnalysisProduction AnalysisOthers