Smart Glasses Market Size, Growth, Trends | Report 2023-2032
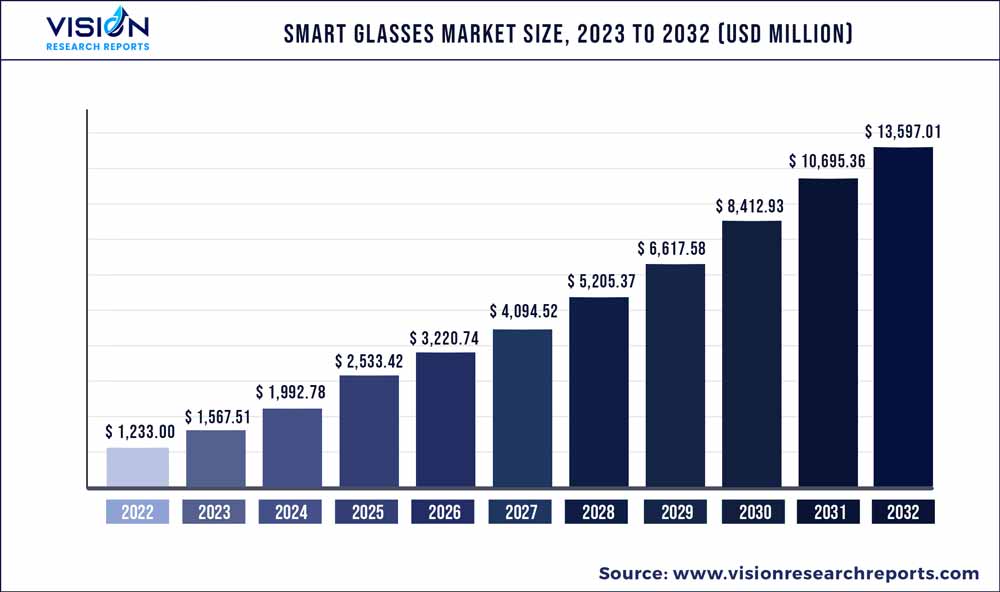
The global smart glasses market was valued at USD 1,233.00 million in 2022 and it is predicted to surpass around USD 13,597.01 million by 2032 with a CAGR of 27.13% from 2023 to 2032.
Key Pointers
Report Scope of the Smart Glasses Market
| Report Coverage | Details |
| Market Size in 2022 | USD 1,233.00 million |
| Revenue Forecast by 2032 | USD 13,597.01 million |
| Growth rate from 2023 to 2032 | CAGR of 27.13% |
| Base Year | 2022 |
| Forecast Period | 2023 to 2032 |
| Market Analysis (Terms Used) | Value (US$ Million/Billion) or (Volume/Units) |
| Regions Covered | North America, Europe, Asia Pacific, Latin America, Middle East & Africa |
| Companies Covered | Amazon Inc.; Ampere LLC; Bose Corporation; Flows Bandwidth; Google LLC; Lenovo; Lumus Ltd.; Magic Leap; Microsoft Corporation; Razer Inc.; Sony Corporation; TCL; Vuzix Corporation; Qualcomm Technologies, Inc.; Seiko Epson Corp. |
The promising growth prospects of the market can be credited to the growing adoption of wearable computing technologies coupled with improvement in operations efficiency. Moreover, the ability of smart glasses to offer Augmented Reality (AR) visuals, including weather imaging, stocks, text messages, calender, and teleprompter-like functions is expected to drive the market growth further.
Smart glasses are usually equipped with behind-the-ear speakers for music playback, hands-free calling, and activity tracking. Moreover, it also detects accurate and precise measurements, which has led to an increase in its use in the aerospace and defense, architecture and construction, medical, electronics, energy and power, heavy machinery, and entertainment sectors. This, in turn, is expected to drive the market growth further.
The key market players are focusing on partnerships and collaborations to cater the consumer demands. For instance, in September 2020 Meta Platforms, Inc. announced the partnership with EssilorLuxottica to develop next generation smart glasses. The collaboration has helped companies to combine their experience in technology and fashion to create the advanced lens technology to help people stay better connected to their friends and family.
Type Insights
The audio smart glasses segment registered for the largest revenue share of around 29.03% of the market in 2022. These audio smart glasses works as a substitute for earphones or headphones as they provide audio to the speakers attached to the glasses via cable running through the sunglasses' steel hinges. Additionally, it produces crystal clear sound that goes straight into ears without any hinderances from outside, which is expected to drive the growth further.
The immersive smart glasses segment is estimated to register the fastest CAGR growth of over 29.04% during the forecast period. This can be attributed to the sensors used that make sense of surroundings and accurately overlay computer-generated objects naturally. For instance, Microsoft Corporation introduced HoloLens 2, which helps to connect and collaborate from anywhere with Dynamics 365 Remote Assist.
Glass Tinting Technology Insights
The electrochromic (EC) smart glass segment accounted for highest CAGR of over 29.11% during forecast period. This can be attributed to the increasing use of the technology by the people for outdoor sports or activities, as this technology helps in adjusting the level of tint in realtime with the help of dedicated application. Moreover, the ability to control the tint level depending upon the environment makes it more demanding. This, in turn, is expected to drive the growth further.
The Polymer-dispersed Liquid Crystals (PDLC) segment accounted for the largest revenue share of over 24.02% in 2022 and is expected to lead the smart glasses market throughout the forecast period. This can be attributed to its capabilities of blocking harmful lights or rays while still maintaining a clear view in front. In addition, its anti-glare properties help reduce the eyestrain and can be customized to operate in a given range of temperatures with switching time of less than a second.
Operating System Insights
The android operating system segment accounted for the largest revenue share of around 48.11% of the overall market in 2022 and is expected to register a significant growth in the forecast period. This can be attributed to the large portion of consumers buying smart glasses, belong to the personal use category. The easy-to-use interface of android, familiarity with the OS due to smartphones, and power management & application control abilities are driving the segment growth.
The linux operating system segment is expected to expand at a CAGR of over 28.03% from 2023 to 2032. Avaibility of linux kernel as free and open source making it as a preffered operarting system by numerous players in the market. Additionally, linux offers user-friendly interface and can be easiliy modified and designed as per products to make them stand out, which is expected to drive the segment growth further.
Connectivity Insights
The bluetooth segment accounted for the largest revenue share of around 50.04% of the overall market in 2022 and is expected to register a significant growth in the forecast period. This can be attributed to the easy to use connectivity of smart glasses with smartphones, tablets, among other smart devices. For instance, in September 2022, Ambrane India Pvt Ltd. has announced the launch of Ambrane Glares, smart glasses that includes open ear speaker system, bluetooth V5.1, and more features. Furthermore the product is certified with UV400 UV certification.
The USB segment is expected to expand at a CAGR of nearly 30.06% from 2023 to 2032. Avaibility of better quality of full HD display that supports 3D content with $K resolution support is expected to drive the segment growth. For instance, TLC launched their first generation NXTWEAR G smart glasses with USB type-C connectivity. The product comes with Sony OLED lenses equating to a 140-inch view.
Application Insights
The industrial smart glass segment accounted for the largest revenue share of over 27.01% in 2022 and is expected to lead the smart glasses market throughout the forecast period. This can be attributed to its usage in production line, as it displays step-by-step assembly instructions in worker’s field vision, which makes it more convenient to follow instructions and work efficiently with maximum output. This, in turn, is expected to drive the segment growth further.
The healthcare smart glasses segment is expected to register fastest CAGR growth of over 28.08% over the forecast period. In healthcare segment, smart glasses can offer heads-up, see-through, eye-on technology that enables the user to maintain eye contact with the patient while maintaining full situational awareness and providing a clear picture of the patient's area of interest, which is expected to drive the segment growth further.
Regional Insights
The North American market accounted for a sizeable revenue share of over 34.13% in 2022, owing to the rapid advancement in technologies and collaboration by enterprises in the region. Moreover, growing popularity of smart glasses among athletes and fitness enthusiasts in countries like the U.S. and Canada is expected to fuel the market growth. For instance, Everysight Raptor and Solos Smart Glasses are specifically designed for cyclists, runner, and triathletes as it helps them to reach their full potential with real time display of information such as average speed, heart rate, among others. The strong presence of several leading market players, such as Amazon Inc. and Bose Corporation is also expected to create lucrative growth prospects for the market.
The Asia Pacific market accounted for the highest CAGR of 30.04% during the forecast period. This can be attributed to rising disposable income and increasing demand for luxury, which are favoring the expansion of the regional market. Additionally, increased adoption of IoT applications and artificial intelligence in the region is expected to boost the market growth further in the region. For instance, in June 2022, NoiseFit: Health & Fitness Services launched their first pait of smart glasses for India.
Smart Glasses Market Segmentations:
By Type
By Tinting Technology
By Operating System
By Application
By Connectivity
By Regional
Chapter 1. Introduction
1.1. Research Objective
1.2. Scope of the Study
1.3. Definition
Chapter 2. Research Methodology
2.1. Research Approach
2.2. Data Sources
2.3. Assumptions & Limitations
Chapter 3. Executive Summary
3.1. Market Snapshot
Chapter 4. Market Variables and Scope
4.1. Introduction
4.2. Market Classification and Scope
4.3. Industry Value Chain Analysis
4.3.1. Raw Material Procurement Analysis
4.3.2. Sales and Distribution Channel Analysis
4.3.3. Downstream Buyer Analysis
Chapter 5. COVID 19 Impact on Smart Glasses Market
5.1. COVID-19 Landscape: Smart Glasses Industry Impact
5.2. COVID 19 - Impact Assessment for the Industry
5.3. COVID 19 Impact: Global Major Government Policy
5.4. Market Trends and Opportunities in the COVID-19 Landscape
Chapter 6. Market Dynamics Analysis and Trends
6.1. Market Dynamics
6.1.1. Market Drivers
6.1.2. Market Restraints
6.1.3. Market Opportunities
6.2. Porter’s Five Forces Analysis
6.2.1. Bargaining power of suppliers
6.2.2. Bargaining power of buyers
6.2.3. Threat of substitute
6.2.4. Threat of new entrants
6.2.5. Degree of competition
Chapter 7. Competitive Landscape
7.1.1. Company Market Share/Positioning Analysis
7.1.2. Key Strategies Adopted by Players
7.1.3. Vendor Landscape
7.1.3.1. List of Suppliers
7.1.3.2. List of Buyers
Chapter 8. Global Smart Glasses Market, By Type
8.1. Smart Glasses Market, by Type, 2023-2032
8.1.1. Monocular Smart Glasses
8.1.1.1. Market Revenue and Forecast (2020-2032)
8.1.2. Binocular Smart Glasses
8.1.2.1. Market Revenue and Forecast (2020-2032)
8.1.3. Audio Smart Glasses
8.1.3.1. Market Revenue and Forecast (2020-2032)
8.1.4. Immersive Smart Glasses
8.1.4.1. Market Revenue and Forecast (2020-2032)
8.1.5. Others
8.1.5.1. Market Revenue and Forecast (2020-2032)
Chapter 9. Global Smart Glasses Market, By Tinting Technology
9.1. Smart Glasses Market, by Tinting Technology, 2023-2032
9.1.1. Polymer-Dispersed Liquid Crystals
9.1.1.1. Market Revenue and Forecast (2020-2032)
9.1.2. Electrochromic (EC) Smart Glass
9.1.2.1. Market Revenue and Forecast (2020-2032)
9.1.3. Photochromic
9.1.3.1. Market Revenue and Forecast (2020-2032)
9.1.4. Suspended Particles Device (SPD)
9.1.4.1. Market Revenue and Forecast (2020-2032)
9.1.5. Others
9.1.5.1. Market Revenue and Forecast (2020-2032)
Chapter 10. Global Smart Glasses Market, By Operating System
10.1. Smart Glasses Market, by Operating System, 2023-2032
10.1.1. Android
10.1.1.1. Market Revenue and Forecast (2020-2032)
10.1.2. Linux
10.1.2.1. Market Revenue and Forecast (2020-2032)
10.1.3. Other
10.1.3.1. Market Revenue and Forecast (2020-2032)
Chapter 11. Global Smart Glasses Market, By Application
11.1. Smart Glasses Market, by Application, 2023-2032
11.1.1. Education
11.1.1.1. Market Revenue and Forecast (2020-2032)
11.1.2. Gaming
11.1.2.1. Market Revenue and Forecast (2020-2032)
11.1.3. Healthcare
11.1.3.1. Market Revenue and Forecast (2020-2032)
11.1.4. Industrial
11.1.4.1. Market Revenue and Forecast (2020-2032)
11.1.5. Others
11.1.5.1. Market Revenue and Forecast (2020-2032)
Chapter 12. Global Smart Glasses Market, By Connectivity
12.1. Smart Glasses Market, by Connectivity, 2023-2032
12.1.1. Bluetooth
12.1.1.1. Market Revenue and Forecast (2020-2032)
12.1.2. HDMI
12.1.2.1. Market Revenue and Forecast (2020-2032)
12.1.3. USB
12.1.3.1. Market Revenue and Forecast (2020-2032)
Chapter 13. Global Smart Glasses Market, Regional Estimates and Trend Forecast
13.1. North America
13.1.1. Market Revenue and Forecast, by Type (2020-2032)
13.1.2. Market Revenue and Forecast, by Tinting Technology (2020-2032)
13.1.3. Market Revenue and Forecast, by Operating System (2020-2032)
13.1.4. Market Revenue and Forecast, by Application (2020-2032)
13.1.5. Market Revenue and Forecast, by Connectivity (2020-2032)
13.1.6. U.S.
13.1.6.1. Market Revenue and Forecast, by Type (2020-2032)
13.1.6.2. Market Revenue and Forecast, by Tinting Technology (2020-2032)
13.1.6.3. Market Revenue and Forecast, by Operating System (2020-2032)
13.1.6.4. Market Revenue and Forecast, by Application (2020-2032)
13.1.7. Market Revenue and Forecast, by Connectivity (2020-2032)
13.1.8. Rest of North America
13.1.8.1. Market Revenue and Forecast, by Type (2020-2032)
13.1.8.2. Market Revenue and Forecast, by Tinting Technology (2020-2032)
13.1.8.3. Market Revenue and Forecast, by Operating System (2020-2032)
13.1.8.4. Market Revenue and Forecast, by Application (2020-2032)
13.1.8.5. Market Revenue and Forecast, by Connectivity (2020-2032)
13.2. Europe
13.2.1. Market Revenue and Forecast, by Type (2020-2032)
13.2.2. Market Revenue and Forecast, by Tinting Technology (2020-2032)
13.2.3. Market Revenue and Forecast, by Operating System (2020-2032)
13.2.4. Market Revenue and Forecast, by Application (2020-2032)
13.2.5. Market Revenue and Forecast, by Connectivity (2020-2032)
13.2.6. UK
13.2.6.1. Market Revenue and Forecast, by Type (2020-2032)
13.2.6.2. Market Revenue and Forecast, by Tinting Technology (2020-2032)
13.2.6.3. Market Revenue and Forecast, by Operating System (2020-2032)
13.2.7. Market Revenue and Forecast, by Application (2020-2032)
13.2.8. Market Revenue and Forecast, by Connectivity (2020-2032)
13.2.9. Germany
13.2.9.1. Market Revenue and Forecast, by Type (2020-2032)
13.2.9.2. Market Revenue and Forecast, by Tinting Technology (2020-2032)
13.2.9.3. Market Revenue and Forecast, by Operating System (2020-2032)
13.2.10. Market Revenue and Forecast, by Application (2020-2032)
13.2.11. Market Revenue and Forecast, by Connectivity (2020-2032)
13.2.12. France
13.2.12.1. Market Revenue and Forecast, by Type (2020-2032)
13.2.12.2. Market Revenue and Forecast, by Tinting Technology (2020-2032)
13.2.12.3. Market Revenue and Forecast, by Operating System (2020-2032)
13.2.12.4. Market Revenue and Forecast, by Application (2020-2032)
13.2.13. Market Revenue and Forecast, by Connectivity (2020-2032)
13.2.14. Rest of Europe
13.2.14.1. Market Revenue and Forecast, by Type (2020-2032)
13.2.14.2. Market Revenue and Forecast, by Tinting Technology (2020-2032)
13.2.14.3. Market Revenue and Forecast, by Operating System (2020-2032)
13.2.14.4. Market Revenue and Forecast, by Application (2020-2032)
13.2.15. Market Revenue and Forecast, by Connectivity (2020-2032)
13.3. APAC
13.3.1. Market Revenue and Forecast, by Type (2020-2032)
13.3.2. Market Revenue and Forecast, by Tinting Technology (2020-2032)
13.3.3. Market Revenue and Forecast, by Operating System (2020-2032)
13.3.4. Market Revenue and Forecast, by Application (2020-2032)
13.3.5. Market Revenue and Forecast, by Connectivity (2020-2032)
13.3.6. India
13.3.6.1. Market Revenue and Forecast, by Type (2020-2032)
13.3.6.2. Market Revenue and Forecast, by Tinting Technology (2020-2032)
13.3.6.3. Market Revenue and Forecast, by Operating System (2020-2032)
13.3.6.4. Market Revenue and Forecast, by Application (2020-2032)
13.3.7. Market Revenue and Forecast, by Connectivity (2020-2032)
13.3.8. China
13.3.8.1. Market Revenue and Forecast, by Type (2020-2032)
13.3.8.2. Market Revenue and Forecast, by Tinting Technology (2020-2032)
13.3.8.3. Market Revenue and Forecast, by Operating System (2020-2032)
13.3.8.4. Market Revenue and Forecast, by Application (2020-2032)
13.3.9. Market Revenue and Forecast, by Connectivity (2020-2032)
13.3.10. Japan
13.3.10.1. Market Revenue and Forecast, by Type (2020-2032)
13.3.10.2. Market Revenue and Forecast, by Tinting Technology (2020-2032)
13.3.10.3. Market Revenue and Forecast, by Operating System (2020-2032)
13.3.10.4. Market Revenue and Forecast, by Application (2020-2032)
13.3.10.5. Market Revenue and Forecast, by Connectivity (2020-2032)
13.3.11. Rest of APAC
13.3.11.1. Market Revenue and Forecast, by Type (2020-2032)
13.3.11.2. Market Revenue and Forecast, by Tinting Technology (2020-2032)
13.3.11.3. Market Revenue and Forecast, by Operating System (2020-2032)
13.3.11.4. Market Revenue and Forecast, by Application (2020-2032)
13.3.11.5. Market Revenue and Forecast, by Connectivity (2020-2032)
13.4. MEA
13.4.1. Market Revenue and Forecast, by Type (2020-2032)
13.4.2. Market Revenue and Forecast, by Tinting Technology (2020-2032)
13.4.3. Market Revenue and Forecast, by Operating System (2020-2032)
13.4.4. Market Revenue and Forecast, by Application (2020-2032)
13.4.5. Market Revenue and Forecast, by Connectivity (2020-2032)
13.4.6. GCC
13.4.6.1. Market Revenue and Forecast, by Type (2020-2032)
13.4.6.2. Market Revenue and Forecast, by Tinting Technology (2020-2032)
13.4.6.3. Market Revenue and Forecast, by Operating System (2020-2032)
13.4.6.4. Market Revenue and Forecast, by Application (2020-2032)
13.4.7. Market Revenue and Forecast, by Connectivity (2020-2032)
13.4.8. North Africa
13.4.8.1. Market Revenue and Forecast, by Type (2020-2032)
13.4.8.2. Market Revenue and Forecast, by Tinting Technology (2020-2032)
13.4.8.3. Market Revenue and Forecast, by Operating System (2020-2032)
13.4.8.4. Market Revenue and Forecast, by Application (2020-2032)
13.4.9. Market Revenue and Forecast, by Connectivity (2020-2032)
13.4.10. South Africa
13.4.10.1. Market Revenue and Forecast, by Type (2020-2032)
13.4.10.2. Market Revenue and Forecast, by Tinting Technology (2020-2032)
13.4.10.3. Market Revenue and Forecast, by Operating System (2020-2032)
13.4.10.4. Market Revenue and Forecast, by Application (2020-2032)
13.4.10.5. Market Revenue and Forecast, by Connectivity (2020-2032)
13.4.11. Rest of MEA
13.4.11.1. Market Revenue and Forecast, by Type (2020-2032)
13.4.11.2. Market Revenue and Forecast, by Tinting Technology (2020-2032)
13.4.11.3. Market Revenue and Forecast, by Operating System (2020-2032)
13.4.11.4. Market Revenue and Forecast, by Application (2020-2032)
13.4.11.5. Market Revenue and Forecast, by Connectivity (2020-2032)
13.5. Latin America
13.5.1. Market Revenue and Forecast, by Type (2020-2032)
13.5.2. Market Revenue and Forecast, by Tinting Technology (2020-2032)
13.5.3. Market Revenue and Forecast, by Operating System (2020-2032)
13.5.4. Market Revenue and Forecast, by Application (2020-2032)
13.5.5. Market Revenue and Forecast, by Connectivity (2020-2032)
13.5.6. Brazil
13.5.6.1. Market Revenue and Forecast, by Type (2020-2032)
13.5.6.2. Market Revenue and Forecast, by Tinting Technology (2020-2032)
13.5.6.3. Market Revenue and Forecast, by Operating System (2020-2032)
13.5.6.4. Market Revenue and Forecast, by Application (2020-2032)
13.5.7. Market Revenue and Forecast, by Connectivity (2020-2032)
13.5.8. Rest of LATAM
13.5.8.1. Market Revenue and Forecast, by Type (2020-2032)
13.5.8.2. Market Revenue and Forecast, by Tinting Technology (2020-2032)
13.5.8.3. Market Revenue and Forecast, by Operating System (2020-2032)
13.5.8.4. Market Revenue and Forecast, by Application (2020-2032)
13.5.8.5. Market Revenue and Forecast, by Connectivity (2020-2032)
Chapter 14. Company Profiles
14.1. Amazon Inc.
14.1.1. Company Overview
14.1.2. Product Offerings
14.1.3. Financial Performance
14.1.4. Recent Initiatives
14.2. Ampere LLC
14.2.1. Company Overview
14.2.2. Product Offerings
14.2.3. Financial Performance
14.2.4. Recent Initiatives
14.3. Bose Corporation
14.3.1. Company Overview
14.3.2. Product Offerings
14.3.3. Financial Performance
14.3.4. Recent Initiatives
14.4. Flows Bandwidth
14.4.1. Company Overview
14.4.2. Product Offerings
14.4.3. Financial Performance
14.4.4. Recent Initiatives
14.5. Google LLC
14.5.1. Company Overview
14.5.2. Product Offerings
14.5.3. Financial Performance
14.5.4. Recent Initiatives
14.6. Lenovo
14.6.1. Company Overview
14.6.2. Product Offerings
14.6.3. Financial Performance
14.6.4. Recent Initiatives
14.7. Lumus Ltd.
14.7.1. Company Overview
14.7.2. Product Offerings
14.7.3. Financial Performance
14.7.4. Recent Initiatives
14.8. Magic Leap
14.8.1. Company Overview
14.8.2. Product Offerings
14.8.3. Financial Performance
14.8.4. Recent Initiatives
14.9. Microsoft Corporation
14.9.1. Company Overview
14.9.2. Product Offerings
14.9.3. Financial Performance
14.9.4. Recent Initiatives
14.10. Razer Inc.
14.10.1. Company Overview
14.10.2. Product Offerings
14.10.3. Financial Performance
14.10.4. Recent Initiatives
Chapter 15. Research Methodology
15.1. Primary Research
15.2. Secondary Research
15.3. Assumptions
Chapter 16. Appendix
16.1. About Us
16.2. Glossary of Terms
 Cross-segment Market Size and Analysis for
Mentioned Segments
Additional Company Profiles (Upto 5 With No Cost)
Additional Countries (Apart From Mentioned Countries)
Country/Region-specific Report
Go To Market Strategy
Region Specific Market DynamicsRegion Level Market Share Import Export AnalysisProduction AnalysisOthers
Cross-segment Market Size and Analysis for
Mentioned Segments
Additional Company Profiles (Upto 5 With No Cost)
Additional Countries (Apart From Mentioned Countries)
Country/Region-specific Report
Go To Market Strategy
Region Specific Market DynamicsRegion Level Market Share Import Export AnalysisProduction AnalysisOthers