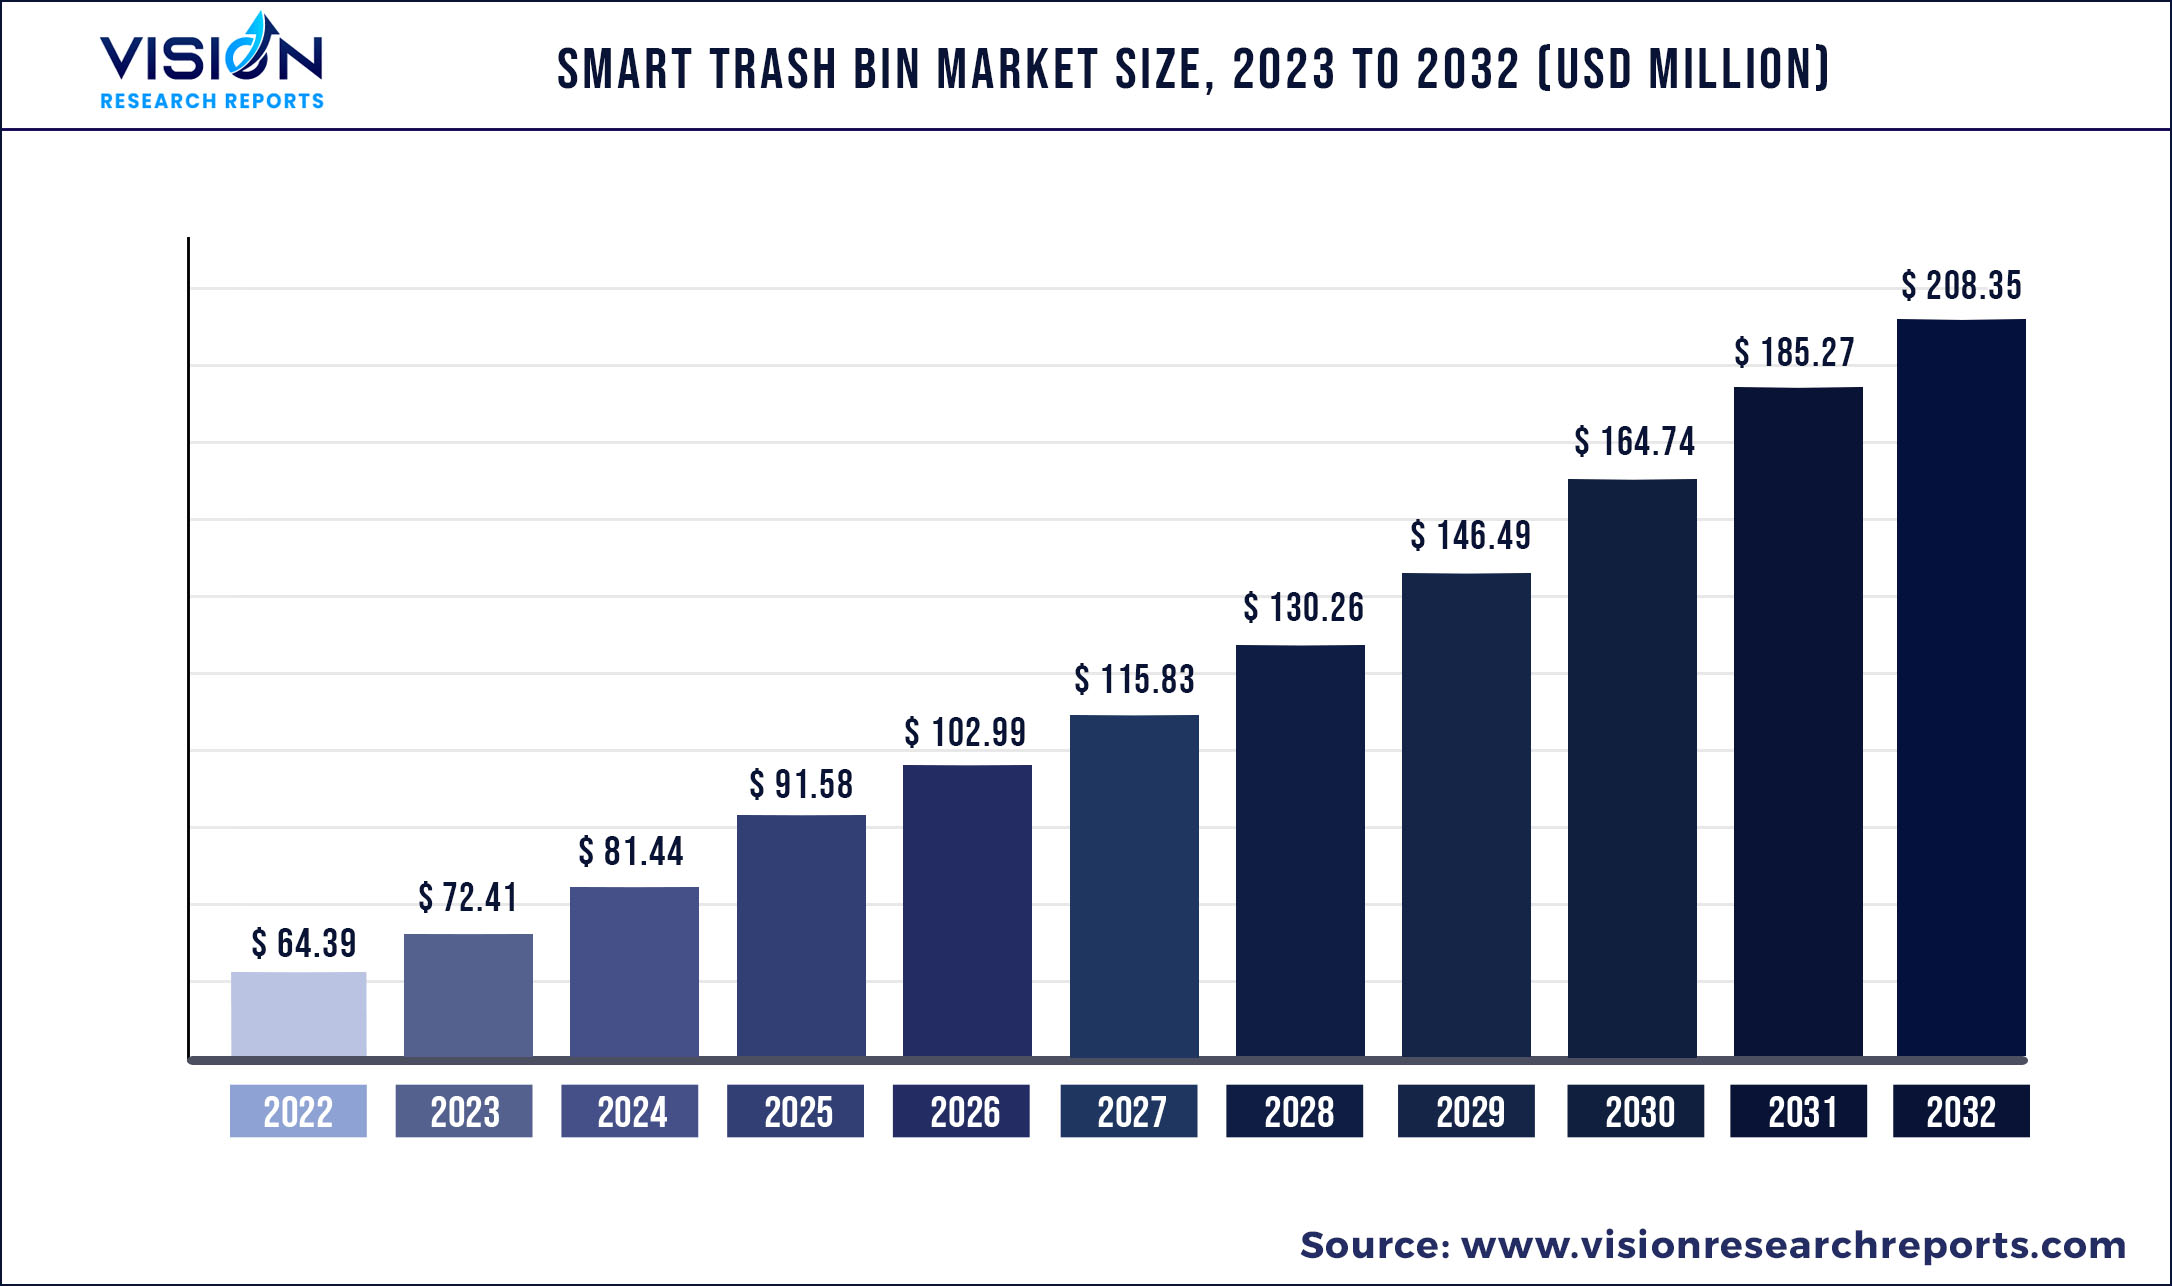
The global smart trash bin market was valued at USD 64.39 million in 2022 and it is predicted to surpass around USD 208.35 million by 2032 with a CAGR of 12.46% from 2023 to 2032.
Key Pointers
Report Scope of the Smart Trash Bin Market
| Report Coverage | Details |
| Market Size in 2022 | USD 64.39 million |
| Revenue Forecast by 2032 | USD 208.35 million |
| Growth rate from 2023 to 2032 | CAGR of 12.46% |
| Base Year | 2022 |
| Forecast Period | 2023 to 2032 |
| Market Analysis (Terms Used) | Value (US$ Million/Billion) or (Volume/Units) |
| Regions Covered | North America, Europe, Asia Pacific, Latin America, Middle East & Africa |
| Companies Covered | Ausko Pte Ltd.; iTouchless Housewares & Products; Inc.; EcubeLabs; Simplehuman; HANGSHAU Houseware Co.; Ltd.; EKO USA; Home Depot; Inc.; EvoEco; CleanRobotics; Nine Stars Group Inc; Binology LLC; Honey Can Do International; BIG BELLY LLC. |
The industry is growing widely due to the increasing implementation for smart city programs across the globe. The growth of smart cities worldwide has created a need for innovative waste management solutions. Smart trash bins are equipped with sensors, cameras, and other technologies to detect when they are full, compact the trash, and notify waste management companies when they need to be emptied.
Furthermore, the growing need for effective waste management across the globe is another major factor fueling the market growth. The increasing amount of garbage generated worldwide has put pressure on waste management systems. In order to cater to such problems, the local government bodies across the countries have conducted various novel programs. For instance, in November 2021,the Environmental Protection Agency (EPA) announced its biggest investment for waste management in the U.S., of around USD 375 million which was targeted at recycling and waste reduction projects. The funding would launch several new projects at the state and municipal levels to combat pollution and inappropriate waste management, including the Solid Waste Infrastructure for Recycling, Recycling Education and Outreach Grant Programs.
Additionally, the market is expected to be driven by the rising proliferation of Internet of Things (IoT) and Artificial Intelligence (AI) technologies.Smart trash bins are equipped with sensors, cameras, and other technologies that can detect when they are full and automatically compact the garbage. These technologies are enabled by the integration of IoT and AI, making smart trash bins more efficient and effective than traditional waste management systems. Moreover, smart trash bins generate real-time data on waste generation, collection, and disposal. This data can be analyzed using AI algorithms to identify patterns and optimize waste management systems further.
The smart trash bin market has significant potential for growth and innovation as cities and businesses increasingly prioritize sustainability and environmental responsibility. By leveraging IoT, AI, and other technologies, smart trash bins can help transform waste management practices and promote a more sustainable future. However, the high cost of the product and the lack of awareness among consumers about the benefits of these bins are some of the factors that may restrain the growth of the market.
The COVID-19 pandemic has had a significant impact on the global economy, with many industries and markets being affected. Also, the pandemic is a cause to several changes and disruptions in this industry. One of the most significant impacts of the pandemic witnessed is the increased demand for contactless garbage disposal solutions. With the emphasis on reducing contact with potentially contaminated surfaces, the demand for smart trash bins equipped with sensors and automated opening and closing mechanisms has increased. These contactless solutions allow touch-free garbage disposal and reduces the risk of cross-contamination.
Smart Trash Bin Market Segmentations:
| By Capacity | By Sales Channel | By End-user | By Operation | By Compartment |
|
8 to 13 gallon 14 to 23 gallon above 23 gallon |
Online Offline |
Residential Commercial |
Automatic Semi-Automatic |
Single Compartment Multi-compartment |
Chapter 1. Introduction
1.1. Research Objective
1.2. Scope of the Study
1.3. Definition
Chapter 2. Research Methodology
2.1. Research Approach
2.2. Data Sources
2.3. Assumptions & Limitations
Chapter 3. Executive Summary
3.1. Market Snapshot
Chapter 4. Market Variables and Scope
4.1. Introduction
4.2. Market Classification and Scope
4.3. Industry Value Chain Analysis
4.3.1. Raw Material Procurement Analysis
4.3.2. Sales and Distribution Channel Analysis
4.3.3. Downstream Buyer Analysis
Chapter 5. COVID 19 Impact on Smart Trash Bin Market
5.1. COVID-19 Landscape: Smart Trash Bin Industry Impact
5.2. COVID 19 - Impact Assessment for the Industry
5.3. COVID 19 Impact: Global Major Government Policy
5.4. Market Trends and Opportunities in the COVID-19 Landscape
Chapter 6. Market Dynamics Analysis and Trends
6.1. Market Dynamics
6.1.1. Market Drivers
6.1.2. Market Restraints
6.1.3. Market Opportunities
6.2. Porter’s Five Forces Analysis
6.2.1. Bargaining power of suppliers
6.2.2. Bargaining power of buyers
6.2.3. Threat of substitute
6.2.4. Threat of new entrants
6.2.5. Degree of competition
Chapter 7. Competitive Landscape
7.1.1. Company Market Share/Positioning Analysis
7.1.2. Key Strategies Adopted by Players
7.1.3. Vendor Landscape
7.1.3.1. List of Suppliers
7.1.3.2. List of Buyers
Chapter 8. Global Smart Trash Bin Market, By Capacity
8.1. Smart Trash Bin Market, by Capacity, 2023-2032
8.1.1. 8 to 13 gallon
8.1.1.1. Market Revenue and Forecast (2020-2032)
8.1.2. 14 to 23 gallon
8.1.2.1. Market Revenue and Forecast (2020-2032)
8.1.3. above 23 gallon
8.1.3.1. Market Revenue and Forecast (2020-2032)
Chapter 9. Global Smart Trash Bin Market, By Sales Channel
9.1. Smart Trash Bin Market, by Sales Channel, 2023-2032
9.1.1. Online
9.1.1.1. Market Revenue and Forecast (2020-2032)
9.1.2. Offline
9.1.2.1. Market Revenue and Forecast (2020-2032)
Chapter 10. Global Smart Trash Bin Market, By End-user
10.1. Smart Trash Bin Market, by End-user, 2023-2032
10.1.1. Residential
10.1.1.1. Market Revenue and Forecast (2020-2032)
10.1.2. Commercial
10.1.2.1. Market Revenue and Forecast (2020-2032)
Chapter 11. Global Smart Trash Bin Market, By Operation
11.1. Smart Trash Bin Market, by Operation, 2023-2032
11.1.1. Automatic
11.1.1.1. Market Revenue and Forecast (2020-2032)
11.1.2. Semi-Automatic
11.1.2.1. Market Revenue and Forecast (2020-2032)
Chapter 12. Global Smart Trash Bin Market, By Compartment
12.1. Smart Trash Bin Market, by Compartment, 2023-2032
12.1.1. Single Compartment
12.1.1.1. Market Revenue and Forecast (2020-2032)
12.1.2. Multi-compartment
12.1.2.1. Market Revenue and Forecast (2020-2032)
Chapter 13. Global Smart Trash Bin Market, Regional Estimates and Trend Forecast
13.1. North America
13.1.1. Market Revenue and Forecast, by Capacity (2020-2032)
13.1.2. Market Revenue and Forecast, by Sales Channel (2020-2032)
13.1.3. Market Revenue and Forecast, by End-user (2020-2032)
13.1.4. Market Revenue and Forecast, by Operation (2020-2032)
13.1.5. Market Revenue and Forecast, by Compartment (2020-2032)
13.1.6. U.S.
13.1.6.1. Market Revenue and Forecast, by Capacity (2020-2032)
13.1.6.2. Market Revenue and Forecast, by Sales Channel (2020-2032)
13.1.6.3. Market Revenue and Forecast, by End-user (2020-2032)
13.1.6.4. Market Revenue and Forecast, by Operation (2020-2032)
13.1.7. Market Revenue and Forecast, by Compartment (2020-2032)
13.1.8. Rest of North America
13.1.8.1. Market Revenue and Forecast, by Capacity (2020-2032)
13.1.8.2. Market Revenue and Forecast, by Sales Channel (2020-2032)
13.1.8.3. Market Revenue and Forecast, by End-user (2020-2032)
13.1.8.4. Market Revenue and Forecast, by Operation (2020-2032)
13.1.8.5. Market Revenue and Forecast, by Compartment (2020-2032)
13.2. Europe
13.2.1. Market Revenue and Forecast, by Capacity (2020-2032)
13.2.2. Market Revenue and Forecast, by Sales Channel (2020-2032)
13.2.3. Market Revenue and Forecast, by End-user (2020-2032)
13.2.4. Market Revenue and Forecast, by Operation (2020-2032)
13.2.5. Market Revenue and Forecast, by Compartment (2020-2032)
13.2.6. UK
13.2.6.1. Market Revenue and Forecast, by Capacity (2020-2032)
13.2.6.2. Market Revenue and Forecast, by Sales Channel (2020-2032)
13.2.6.3. Market Revenue and Forecast, by End-user (2020-2032)
13.2.7. Market Revenue and Forecast, by Operation (2020-2032)
13.2.8. Market Revenue and Forecast, by Compartment (2020-2032)
13.2.9. Germany
13.2.9.1. Market Revenue and Forecast, by Capacity (2020-2032)
13.2.9.2. Market Revenue and Forecast, by Sales Channel (2020-2032)
13.2.9.3. Market Revenue and Forecast, by End-user (2020-2032)
13.2.10. Market Revenue and Forecast, by Operation (2020-2032)
13.2.11. Market Revenue and Forecast, by Compartment (2020-2032)
13.2.12. France
13.2.12.1. Market Revenue and Forecast, by Capacity (2020-2032)
13.2.12.2. Market Revenue and Forecast, by Sales Channel (2020-2032)
13.2.12.3. Market Revenue and Forecast, by End-user (2020-2032)
13.2.12.4. Market Revenue and Forecast, by Operation (2020-2032)
13.2.13. Market Revenue and Forecast, by Compartment (2020-2032)
13.2.14. Rest of Europe
13.2.14.1. Market Revenue and Forecast, by Capacity (2020-2032)
13.2.14.2. Market Revenue and Forecast, by Sales Channel (2020-2032)
13.2.14.3. Market Revenue and Forecast, by End-user (2020-2032)
13.2.14.4. Market Revenue and Forecast, by Operation (2020-2032)
13.2.15. Market Revenue and Forecast, by Compartment (2020-2032)
13.3. APAC
13.3.1. Market Revenue and Forecast, by Capacity (2020-2032)
13.3.2. Market Revenue and Forecast, by Sales Channel (2020-2032)
13.3.3. Market Revenue and Forecast, by End-user (2020-2032)
13.3.4. Market Revenue and Forecast, by Operation (2020-2032)
13.3.5. Market Revenue and Forecast, by Compartment (2020-2032)
13.3.6. India
13.3.6.1. Market Revenue and Forecast, by Capacity (2020-2032)
13.3.6.2. Market Revenue and Forecast, by Sales Channel (2020-2032)
13.3.6.3. Market Revenue and Forecast, by End-user (2020-2032)
13.3.6.4. Market Revenue and Forecast, by Operation (2020-2032)
13.3.7. Market Revenue and Forecast, by Compartment (2020-2032)
13.3.8. China
13.3.8.1. Market Revenue and Forecast, by Capacity (2020-2032)
13.3.8.2. Market Revenue and Forecast, by Sales Channel (2020-2032)
13.3.8.3. Market Revenue and Forecast, by End-user (2020-2032)
13.3.8.4. Market Revenue and Forecast, by Operation (2020-2032)
13.3.9. Market Revenue and Forecast, by Compartment (2020-2032)
13.3.10. Japan
13.3.10.1. Market Revenue and Forecast, by Capacity (2020-2032)
13.3.10.2. Market Revenue and Forecast, by Sales Channel (2020-2032)
13.3.10.3. Market Revenue and Forecast, by End-user (2020-2032)
13.3.10.4. Market Revenue and Forecast, by Operation (2020-2032)
13.3.10.5. Market Revenue and Forecast, by Compartment (2020-2032)
13.3.11. Rest of APAC
13.3.11.1. Market Revenue and Forecast, by Capacity (2020-2032)
13.3.11.2. Market Revenue and Forecast, by Sales Channel (2020-2032)
13.3.11.3. Market Revenue and Forecast, by End-user (2020-2032)
13.3.11.4. Market Revenue and Forecast, by Operation (2020-2032)
13.3.11.5. Market Revenue and Forecast, by Compartment (2020-2032)
13.4. MEA
13.4.1. Market Revenue and Forecast, by Capacity (2020-2032)
13.4.2. Market Revenue and Forecast, by Sales Channel (2020-2032)
13.4.3. Market Revenue and Forecast, by End-user (2020-2032)
13.4.4. Market Revenue and Forecast, by Operation (2020-2032)
13.4.5. Market Revenue and Forecast, by Compartment (2020-2032)
13.4.6. GCC
13.4.6.1. Market Revenue and Forecast, by Capacity (2020-2032)
13.4.6.2. Market Revenue and Forecast, by Sales Channel (2020-2032)
13.4.6.3. Market Revenue and Forecast, by End-user (2020-2032)
13.4.6.4. Market Revenue and Forecast, by Operation (2020-2032)
13.4.7. Market Revenue and Forecast, by Compartment (2020-2032)
13.4.8. North Africa
13.4.8.1. Market Revenue and Forecast, by Capacity (2020-2032)
13.4.8.2. Market Revenue and Forecast, by Sales Channel (2020-2032)
13.4.8.3. Market Revenue and Forecast, by End-user (2020-2032)
13.4.8.4. Market Revenue and Forecast, by Operation (2020-2032)
13.4.9. Market Revenue and Forecast, by Compartment (2020-2032)
13.4.10. South Africa
13.4.10.1. Market Revenue and Forecast, by Capacity (2020-2032)
13.4.10.2. Market Revenue and Forecast, by Sales Channel (2020-2032)
13.4.10.3. Market Revenue and Forecast, by End-user (2020-2032)
13.4.10.4. Market Revenue and Forecast, by Operation (2020-2032)
13.4.10.5. Market Revenue and Forecast, by Compartment (2020-2032)
13.4.11. Rest of MEA
13.4.11.1. Market Revenue and Forecast, by Capacity (2020-2032)
13.4.11.2. Market Revenue and Forecast, by Sales Channel (2020-2032)
13.4.11.3. Market Revenue and Forecast, by End-user (2020-2032)
13.4.11.4. Market Revenue and Forecast, by Operation (2020-2032)
13.4.11.5. Market Revenue and Forecast, by Compartment (2020-2032)
13.5. Latin America
13.5.1. Market Revenue and Forecast, by Capacity (2020-2032)
13.5.2. Market Revenue and Forecast, by Sales Channel (2020-2032)
13.5.3. Market Revenue and Forecast, by End-user (2020-2032)
13.5.4. Market Revenue and Forecast, by Operation (2020-2032)
13.5.5. Market Revenue and Forecast, by Compartment (2020-2032)
13.5.6. Brazil
13.5.6.1. Market Revenue and Forecast, by Capacity (2020-2032)
13.5.6.2. Market Revenue and Forecast, by Sales Channel (2020-2032)
13.5.6.3. Market Revenue and Forecast, by End-user (2020-2032)
13.5.6.4. Market Revenue and Forecast, by Operation (2020-2032)
13.5.7. Market Revenue and Forecast, by Compartment (2020-2032)
13.5.8. Rest of LATAM
13.5.8.1. Market Revenue and Forecast, by Capacity (2020-2032)
13.5.8.2. Market Revenue and Forecast, by Sales Channel (2020-2032)
13.5.8.3. Market Revenue and Forecast, by End-user (2020-2032)
13.5.8.4. Market Revenue and Forecast, by Operation (2020-2032)
13.5.8.5. Market Revenue and Forecast, by Compartment (2020-2032)
Chapter 14. Company Profiles
14.1. Ausko Pte Ltd.
14.1.1. Company Overview
14.1.2. Product Offerings
14.1.3. Financial Performance
14.1.4. Recent Initiatives
14.2. iTouchless Housewares & Products; Inc.
14.2.1. Company Overview
14.2.2. Product Offerings
14.2.3. Financial Performance
14.2.4. Recent Initiatives
14.3. EcubeLabs
14.3.1. Company Overview
14.3.2. Product Offerings
14.3.3. Financial Performance
14.3.4. Recent Initiatives
14.4. Simplehuman
14.4.1. Company Overview
14.4.2. Product Offerings
14.4.3. Financial Performance
14.4.4. Recent Initiatives
14.5. HANGSHAU Houseware Co.; Ltd.
14.5.1. Company Overview
14.5.2. Product Offerings
14.5.3. Financial Performance
14.5.4. Recent Initiatives
14.6. EKO USA
14.6.1. Company Overview
14.6.2. Product Offerings
14.6.3. Financial Performance
14.6.4. Recent Initiatives
14.7. Home Depot; Inc.
14.7.1. Company Overview
14.7.2. Product Offerings
14.7.3. Financial Performance
14.7.4. Recent Initiatives
14.8. EvoEco
14.8.1. Company Overview
14.8.2. Product Offerings
14.8.3. Financial Performance
14.8.4. Recent Initiatives
14.9. CleanRobotics
14.9.1. Company Overview
14.9.2. Product Offerings
14.9.3. Financial Performance
14.9.4. Recent Initiatives
14.10. Nine Stars Group Inc
14.10.1. Company Overview
14.10.2. Product Offerings
14.10.3. Financial Performance
14.10.4. Recent Initiatives
Chapter 15. Research Methodology
15.1. Primary Research
15.2. Secondary Research
15.3. Assumptions
Chapter 16. Appendix
16.1. About Us
16.2. Glossary of Terms
 Cross-segment Market Size and Analysis for
Mentioned Segments
Additional Company Profiles (Upto 5 With No Cost)
Additional Countries (Apart From Mentioned Countries)
Country/Region-specific Report
Go To Market Strategy
Region Specific Market DynamicsRegion Level Market Share Import Export AnalysisProduction AnalysisOthers
Cross-segment Market Size and Analysis for
Mentioned Segments
Additional Company Profiles (Upto 5 With No Cost)
Additional Countries (Apart From Mentioned Countries)
Country/Region-specific Report
Go To Market Strategy
Region Specific Market DynamicsRegion Level Market Share Import Export AnalysisProduction AnalysisOthers