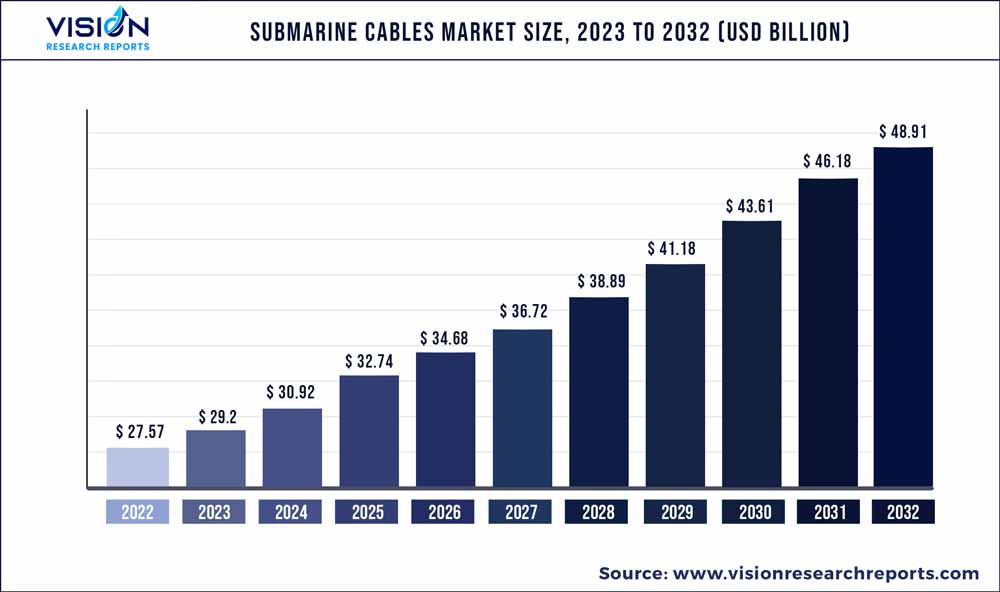
The global submarine cables market was surpassed at USD 27.57 billion in 2022 and is expected to hit around USD 48.91 billion by 2032, growing at a CAGR of 5.9% from 2023 to 2032.
Key Pointers
Report Scope of the Submarine Cables Market
| Report Coverage | Details |
| Market Size in 2022 | USD 27.57 billion |
| Revenue Forecast by 2032 | USD 48.91 billion |
| Growth rate from 2023 to 2032 | CAGR of 5.9% |
| Base Year | 2022 |
| Forecast Period | 2023 to 2032 |
| Market Analysis (Terms Used) | Value (US$ Million/Billion) or (Volume/Units) |
| Regions Covered | North America, Europe, Asia Pacific, Latin America, Middle East & Africa |
| Companies Covered | ALE International; ALE USA Inc.; SubCom, LLC; NEC Corporation; Prysmian S.p.A; Nexans; Google LLC; Amazon.com, Inc.; Microsoft; NKT A/S; ZTT |
Increasing investments in offshore wind farms, inter-country and island connections for improved power supply and communication, and growing investments in oil & gas deep-water drilling activities are the major factors driving the overall market. The increased investment by OTT companies in the deployment of high-capacity communications systems and the growing need for HVDC underwater power cables will provide numerous new opportunities that will lead the market of the submarine cable system. The rising internet and data traffic in the region, such as APAC, are the critical factors driving the market over the forecast period.
The densely populated regions, including APAC, South America, and MEA, actively invest in offshore wind power generation. These investments are expected to fuel the demand for submarine cables. The increasing demand and penetration of the internet, their collaboration with tier-1 vendors, and the rising demand for bandwidth caused due to the rise of 5G are a few factors that propel the demand for submarine cables.
Regional governments worldwide are aiming to increase their electricity generation output from fossil fuel-based sources of energy. The high costs incurred for the installation of cables and the difficulty in restoring and maintaining deep-water cables have adversely affected the adoption and implementation of submarine cables. Several threats, such as fishing hooks, cyclones, ships, and cruises, among others, raise the need for maintenance services. Therefore, proper installation techniques, materials, and the length of the cables propel the overall market growth. Any fault in submarine cables levies hefty costs to be spent on the repair and re-deployment process.
OTT providers are an integral part of market development. These players own, manage, and fund their submarine cables infrastructure. Facebook, Google, Microsoft, and Amazon are amongst the leading OTT providers, which have drastically changed the landscape of the overall market.
Application Insights
The submarine power cable segment accounted for the largest revenue share of around 62.47% in 2022. Increased demand for inter-country and island connections and new capacity expansions in the offshore wind industry are driving the market. Furthermore, the increasing number of offshore wind farms and the increasing electrification of offshore oil and gas networks have increased research and development activities, further increasing the requirement for submarine power cables.
The submarine communication cables segment accounted for a significant share and is thus expected to grow with the fastest compound annual growth rate of 6.85% from 2023 to 2032. There has been a rapid increase in urbanization and economic activities, which will drive the growth in infrastructure and construction segments in both developing and developed countries. The demand from various sectors such as commercial, telecom, energy, and power industries is leading to expansion and up-gradation of infrastructure, which is anticipated to drive the demand for the market. Also, the rising focus on joining offshore renewable energy generation to join future renewable energy targets and increase energy security, providing energy access to remote landmasses, and interlinking national grids to economize energy use has driven the expansion of the market across the globe.
Voltage Insights
The high voltage segment accounted for the largest revenue share of around 65.56% in 2022. High voltage cables ranging above 33kV are widely used for the power transmission and distribution of power. Thus, the increasing demand for HVDC submarine power cables and rising investments in offshore wind power generation is the primary factor driving the high voltage cables segment in the submarine power cables market. In addition, HV cables reduce transmission losses and thus, allow efficient power transmission. The HVDC power system is evolving at high speed and permitting the transfer of electricity from big-capacity high-power sources to the mainland. Several companies and development centers support the growth of HVDC power systems, such as DESERTEC, North Seas Countries Offshore Grid Initiative, CIGRE, and others.
The medium voltage cables segment is expected to grow at a compound annual growth rate of 5.07% from 2022 to 2032. The growth is attributable to the utilization of MV cables in the offshore oil & gas infrastructure for power transmission. The demand from overseas oil & gas operations has been increasing, thus, driving the MV cables market.
End-user Insights
The offshore wind power generation segment accounted for the largest revenue share of over 45.41% of the overall market in 2022. Increasing investments in offshore wind power generation and usage of submarine power cables for long-distance power transmissions from these plants is the primary factor in flourishing the market growth. For instance, in August 2018, Northwestern NV awarded a contract to NSW (a subsidiary of Prysmian S.p.A) to develop the submarine cable system necessary for the offshore wind farm.
The offshore oil & gas segment is expected to grow at a significant compound annual growth rate of 4.72% from 2023 to 2032. Increasing deepwater drilling activities and subsea operations are expected to drive the market over the forecast period. Developing countries in Latin America, the Middle East, and Africa are undertaking new offshore oil & gas investments, influencing market growth. For instance, in March 2019, GTT established an oil & gas unit that is serving oil & gas companies for the secure transmission of data through its submarine cable.
Component Insights
The dry plant products segment led the component type of submarine cable market and accounted for 73.42% of the market. The dry plant products segment is expected to account for the largest market revenue share and provide solid growth opportunities. This is due to cost-effectiveness and recent advancements in the dry plant, such as SDM cables with more fibers and capacity, aluminum conductors, smart cables: emergency alerts for earthquake and tsunami, repeater pump farming, virtualized submarine networks, artificial intelligence, and machine learning in submarine systems.
The wet plant products segment is expected to expand with the fastest CAGR of 7.05% over the forecast period. A wet plant of submarine cable lies between the beach manholes, and submarine cable system equipment is installed between beach manholes. Submarine cables, tilt equalizers, OADMs, repeaters, branching units, gain equalizers, filters, and beach manholes are all components of the wet plant.
Offering Insights
The installation & commissioning segment dominated the market in 2022 and accounted for over 39.01% of the market. This is due to the high cost, installation equipment, and technological procedures required. Submarine cable deployment equipment includes submarine cable vessels, jointing, and testing equipment, operation control software, and underwater installation equipment. Underwater installation equipment for submarine optical cables consists of beach burying equipment, burial machine, underwater robot remotely operating vehicles, and an automatic control system. The segment is expected to witness promising growth opportunities over the forecast period.
Over the forecast years, the upgrade segment is expected to grow at a promising CAGR of 7.0%. Installed cables are a valuable asset, and new technologies typically allow them to be used well beyond their original design specifications, both in terms of capacity and design. Upgrades to SLTE in cable landing stations usually take less than eight months to acquire and implement, compared to an average of 3 years to build a brand-new long-haul cable system (depending on the size).
Regional Insights
The Asia Pacific region accounted for the largest share of around 38.32% of the overall market in 2022. The region has the highest adoption and deployment of wind farms in the region, among which China holds the leading position. According to IEEFA, China had 4.6GW1 of operational offshore wind power capacity in 2018. It installed 1.8GW of offshore wind capacity in 2018 alone, which is 40% of the total 4.5GW added globally during the year. In January 2019, China approved 24 offshore wind power projects off the coast of Jiangsu Province with a total capacity of 6.7GW and an investment injection worth USD 18 billion. The projects are expected to be operational by 2020. China's largest utilities, including China Energy Group, China General Nuclear Power Corp., China Huaneng Group, and the State Power Investment Corp., are backing these offshore wind projects. In addition, in April 2020, Facebook acquired USD 5.7 billion stakes in Reliance Jio (India). Hence, contributing to the rise in demand for submarine cables in the region. The Asia Pacific area is rapidly becoming a center for direct investment in submarine cable infrastructure. The major participants in this are Google, Microsoft, and Facebook. For instance, Google has already invested in Asia's existing submarine cable space. Also, in 2021 Google has invested in the new subsea cable system initiated to connect Japan to Australia via Guam.
The market in the Latin America region is anticipated to grow at the second-highest compound annual growth rate of 5.26% from 2023 to 2032, owing to the increasing investments in wind farms and inter-country & island connections in the region. Also, several submarine cable projects started operations in 2021, For instance, in June 2021, Google announced plans to create Firmina, an open subsea cable that will connect the US East Coast to Las Toninas, Argentina, with landings in Brazil and Uruguay. With the new connection, the company expects to improve internet connectivity for Latin American subscribers while also bolstering its existing cable investments in the region.
Submarine Cables Market Segmentations:
By Application
By Voltage
By End-user
By Offerings
By Component
Chapter 1. Introduction
1.1. Research Objective
1.2. Scope of the Study
1.3. Definition
Chapter 2. Research Methodology
2.1. Research Approach
2.2. Data Sources
2.3. Assumptions & Limitations
Chapter 3. Executive Summary
3.1. Market Snapshot
Chapter 4. Market Variables and Scope
4.1. Introduction
4.2. Market Classification and Scope
4.3. Industry Value Chain Analysis
4.3.1. Raw Material Procurement Analysis
4.3.2. Sales and Distribution Channel Analysis
4.3.3. Downstream Buyer Analysis
Chapter 5. COVID 19 Impact on Submarine Cables Market
5.1. COVID-19 Landscape: Submarine Cables Industry Impact
5.2. COVID 19 - Impact Assessment for the Industry
5.3. COVID 19 Impact: Global Major Government Policy
5.4. Market Trends and Opportunities in the COVID-19 Landscape
Chapter 6. Market Dynamics Analysis and Trends
6.1. Market Dynamics
6.1.1. Market Drivers
6.1.2. Market Restraints
6.1.3. Market Opportunities
6.2. Porter’s Five Forces Analysis
6.2.1. Bargaining power of suppliers
6.2.2. Bargaining power of buyers
6.2.3. Threat of substitute
6.2.4. Threat of new entrants
6.2.5. Degree of competition
Chapter 7. Competitive Landscape
7.1.1. Company Market Share/Positioning Analysis
7.1.2. Key Strategies Adopted by Players
7.1.3. Vendor Landscape
7.1.3.1. List of Suppliers
7.1.3.2. List of Buyers
Chapter 8. Global Submarine Cables Market, By Application
8.1. Submarine Cables Market, by Application, 2023-2032
8.1.1. Submarine Power Cables
8.1.1.1. Market Revenue and Forecast (2020-2032)
8.1.2. Submarine Communication Cables
8.1.2.1. Market Revenue and Forecast (2020-2032)
Chapter 9. Global Submarine Cables Market, By Voltage
9.1. Submarine Cables Market, by Voltage, 2023-2032
9.1.1. Medium Voltage
9.1.1.1. Market Revenue and Forecast (2020-2032)
9.1.2. High Voltage
9.1.2.1. Market Revenue and Forecast (2020-2032)
9.1.3. Extra High Voltage
9.1.3.1. Market Revenue and Forecast (2020-2032)
Chapter 10. Global Submarine Cables Market, By End-user
10.1. Submarine Cables Market, by End-user, 2023-2032
10.1.1. Offshore Wind Power Generation
10.1.1.1. Market Revenue and Forecast (2020-2032)
10.1.2. Inter country & island connection
10.1.2.1. Market Revenue and Forecast (2020-2032)
10.1.3. Offshore Oil & Gas
10.1.3.1. Market Revenue and Forecast (2020-2032)
Chapter 11. Global Submarine Cables Market, By Offerings
11.1. Submarine Cables Market, by Offerings, 2023-2032
11.1.1. Installation & Commissioning
11.1.1.1. Market Revenue and Forecast (2020-2032)
11.1.2. Upgrade
11.1.2.1. Market Revenue and Forecast (2020-2032)
11.1.3. Maintenance
11.1.3.1. Market Revenue and Forecast (2020-2032)
Chapter 12. Global Submarine Cables Market, By Component
12.1. Submarine Cables Market, by Component, 2023-2032
12.1.1. Dry Plant Products
12.1.1.1. Market Revenue and Forecast (2020-2032)
12.1.2. Wet Plant Products
12.1.2.1. Market Revenue and Forecast (2020-2032)
Chapter 13. Global Submarine Cables Market, Regional Estimates and Trend Forecast
13.1. North America
13.1.1. Market Revenue and Forecast, by Application (2020-2032)
13.1.2. Market Revenue and Forecast, by Voltage (2020-2032)
13.1.3. Market Revenue and Forecast, by End-user (2020-2032)
13.1.4. Market Revenue and Forecast, by Offerings (2020-2032)
13.1.5. Market Revenue and Forecast, by Component (2020-2032)
13.1.6. U.S.
13.1.6.1. Market Revenue and Forecast, by Application (2020-2032)
13.1.6.2. Market Revenue and Forecast, by Voltage (2020-2032)
13.1.6.3. Market Revenue and Forecast, by End-user (2020-2032)
13.1.6.4. Market Revenue and Forecast, by Offerings (2020-2032)
13.1.7. Market Revenue and Forecast, by Component (2020-2032)
13.1.8. Rest of North America
13.1.8.1. Market Revenue and Forecast, by Application (2020-2032)
13.1.8.2. Market Revenue and Forecast, by Voltage (2020-2032)
13.1.8.3. Market Revenue and Forecast, by End-user (2020-2032)
13.1.8.4. Market Revenue and Forecast, by Offerings (2020-2032)
13.1.8.5. Market Revenue and Forecast, by Component (2020-2032)
13.2. Europe
13.2.1. Market Revenue and Forecast, by Application (2020-2032)
13.2.2. Market Revenue and Forecast, by Voltage (2020-2032)
13.2.3. Market Revenue and Forecast, by End-user (2020-2032)
13.2.4. Market Revenue and Forecast, by Offerings (2020-2032)
13.2.5. Market Revenue and Forecast, by Component (2020-2032)
13.2.6. UK
13.2.6.1. Market Revenue and Forecast, by Application (2020-2032)
13.2.6.2. Market Revenue and Forecast, by Voltage (2020-2032)
13.2.6.3. Market Revenue and Forecast, by End-user (2020-2032)
13.2.7. Market Revenue and Forecast, by Offerings (2020-2032)
13.2.8. Market Revenue and Forecast, by Component (2020-2032)
13.2.9. Germany
13.2.9.1. Market Revenue and Forecast, by Application (2020-2032)
13.2.9.2. Market Revenue and Forecast, by Voltage (2020-2032)
13.2.9.3. Market Revenue and Forecast, by End-user (2020-2032)
13.2.10. Market Revenue and Forecast, by Offerings (2020-2032)
13.2.11. Market Revenue and Forecast, by Component (2020-2032)
13.2.12. France
13.2.12.1. Market Revenue and Forecast, by Application (2020-2032)
13.2.12.2. Market Revenue and Forecast, by Voltage (2020-2032)
13.2.12.3. Market Revenue and Forecast, by End-user (2020-2032)
13.2.12.4. Market Revenue and Forecast, by Offerings (2020-2032)
13.2.13. Market Revenue and Forecast, by Component (2020-2032)
13.2.14. Rest of Europe
13.2.14.1. Market Revenue and Forecast, by Application (2020-2032)
13.2.14.2. Market Revenue and Forecast, by Voltage (2020-2032)
13.2.14.3. Market Revenue and Forecast, by End-user (2020-2032)
13.2.14.4. Market Revenue and Forecast, by Offerings (2020-2032)
13.2.15. Market Revenue and Forecast, by Component (2020-2032)
13.3. APAC
13.3.1. Market Revenue and Forecast, by Application (2020-2032)
13.3.2. Market Revenue and Forecast, by Voltage (2020-2032)
13.3.3. Market Revenue and Forecast, by End-user (2020-2032)
13.3.4. Market Revenue and Forecast, by Offerings (2020-2032)
13.3.5. Market Revenue and Forecast, by Component (2020-2032)
13.3.6. India
13.3.6.1. Market Revenue and Forecast, by Application (2020-2032)
13.3.6.2. Market Revenue and Forecast, by Voltage (2020-2032)
13.3.6.3. Market Revenue and Forecast, by End-user (2020-2032)
13.3.6.4. Market Revenue and Forecast, by Offerings (2020-2032)
13.3.7. Market Revenue and Forecast, by Component (2020-2032)
13.3.8. China
13.3.8.1. Market Revenue and Forecast, by Application (2020-2032)
13.3.8.2. Market Revenue and Forecast, by Voltage (2020-2032)
13.3.8.3. Market Revenue and Forecast, by End-user (2020-2032)
13.3.8.4. Market Revenue and Forecast, by Offerings (2020-2032)
13.3.9. Market Revenue and Forecast, by Component (2020-2032)
13.3.10. Japan
13.3.10.1. Market Revenue and Forecast, by Application (2020-2032)
13.3.10.2. Market Revenue and Forecast, by Voltage (2020-2032)
13.3.10.3. Market Revenue and Forecast, by End-user (2020-2032)
13.3.10.4. Market Revenue and Forecast, by Offerings (2020-2032)
13.3.10.5. Market Revenue and Forecast, by Component (2020-2032)
13.3.11. Rest of APAC
13.3.11.1. Market Revenue and Forecast, by Application (2020-2032)
13.3.11.2. Market Revenue and Forecast, by Voltage (2020-2032)
13.3.11.3. Market Revenue and Forecast, by End-user (2020-2032)
13.3.11.4. Market Revenue and Forecast, by Offerings (2020-2032)
13.3.11.5. Market Revenue and Forecast, by Component (2020-2032)
13.4. MEA
13.4.1. Market Revenue and Forecast, by Application (2020-2032)
13.4.2. Market Revenue and Forecast, by Voltage (2020-2032)
13.4.3. Market Revenue and Forecast, by End-user (2020-2032)
13.4.4. Market Revenue and Forecast, by Offerings (2020-2032)
13.4.5. Market Revenue and Forecast, by Component (2020-2032)
13.4.6. GCC
13.4.6.1. Market Revenue and Forecast, by Application (2020-2032)
13.4.6.2. Market Revenue and Forecast, by Voltage (2020-2032)
13.4.6.3. Market Revenue and Forecast, by End-user (2020-2032)
13.4.6.4. Market Revenue and Forecast, by Offerings (2020-2032)
13.4.7. Market Revenue and Forecast, by Component (2020-2032)
13.4.8. North Africa
13.4.8.1. Market Revenue and Forecast, by Application (2020-2032)
13.4.8.2. Market Revenue and Forecast, by Voltage (2020-2032)
13.4.8.3. Market Revenue and Forecast, by End-user (2020-2032)
13.4.8.4. Market Revenue and Forecast, by Offerings (2020-2032)
13.4.9. Market Revenue and Forecast, by Component (2020-2032)
13.4.10. South Africa
13.4.10.1. Market Revenue and Forecast, by Application (2020-2032)
13.4.10.2. Market Revenue and Forecast, by Voltage (2020-2032)
13.4.10.3. Market Revenue and Forecast, by End-user (2020-2032)
13.4.10.4. Market Revenue and Forecast, by Offerings (2020-2032)
13.4.10.5. Market Revenue and Forecast, by Component (2020-2032)
13.4.11. Rest of MEA
13.4.11.1. Market Revenue and Forecast, by Application (2020-2032)
13.4.11.2. Market Revenue and Forecast, by Voltage (2020-2032)
13.4.11.3. Market Revenue and Forecast, by End-user (2020-2032)
13.4.11.4. Market Revenue and Forecast, by Offerings (2020-2032)
13.4.11.5. Market Revenue and Forecast, by Component (2020-2032)
13.5. Latin America
13.5.1. Market Revenue and Forecast, by Application (2020-2032)
13.5.2. Market Revenue and Forecast, by Voltage (2020-2032)
13.5.3. Market Revenue and Forecast, by End-user (2020-2032)
13.5.4. Market Revenue and Forecast, by Offerings (2020-2032)
13.5.5. Market Revenue and Forecast, by Component (2020-2032)
13.5.6. Brazil
13.5.6.1. Market Revenue and Forecast, by Application (2020-2032)
13.5.6.2. Market Revenue and Forecast, by Voltage (2020-2032)
13.5.6.3. Market Revenue and Forecast, by End-user (2020-2032)
13.5.6.4. Market Revenue and Forecast, by Offerings (2020-2032)
13.5.7. Market Revenue and Forecast, by Component (2020-2032)
13.5.8. Rest of LATAM
13.5.8.1. Market Revenue and Forecast, by Application (2020-2032)
13.5.8.2. Market Revenue and Forecast, by Voltage (2020-2032)
13.5.8.3. Market Revenue and Forecast, by End-user (2020-2032)
13.5.8.4. Market Revenue and Forecast, by Offerings (2020-2032)
13.5.8.5. Market Revenue and Forecast, by Component (2020-2032)
Chapter 14. Company Profiles
14.1. ALE International
14.1.1. Company Overview
14.1.2. Product Offerings
14.1.3. Financial Performance
14.1.4. Recent Initiatives
14.2. ALE USA Inc.
14.2.1. Company Overview
14.2.2. Product Offerings
14.2.3. Financial Performance
14.2.4. Recent Initiatives
14.3. SubCom, LLC
14.3.1. Company Overview
14.3.2. Product Offerings
14.3.3. Financial Performance
14.3.4. Recent Initiatives
14.4. NEC Corporation
14.4.1. Company Overview
14.4.2. Product Offerings
14.4.3. Financial Performance
14.4.4. Recent Initiatives
14.5. Prysmian S.p.A
14.5.1. Company Overview
14.5.2. Product Offerings
14.5.3. Financial Performance
14.5.4. Recent Initiatives
14.6. Nexans
14.6.1. Company Overview
14.6.2. Product Offerings
14.6.3. Financial Performance
14.6.4. Recent Initiatives
14.7. Google LLC
14.7.1. Company Overview
14.7.2. Product Offerings
14.7.3. Financial Performance
14.7.4. Recent Initiatives
14.8. Amazon.com, Inc.
14.8.1. Company Overview
14.8.2. Product Offerings
14.8.3. Financial Performance
14.8.4. Recent Initiatives
14.9. Microsoft
14.9.1. Company Overview
14.9.2. Product Offerings
14.9.3. Financial Performance
14.9.4. Recent Initiatives
14.10. NKT A/S
14.10.1. Company Overview
14.10.2. Product Offerings
14.10.3. Financial Performance
14.10.4. Recent Initiatives
Chapter 15. Research Methodology
15.1. Primary Research
15.2. Secondary Research
15.3. Assumptions
Chapter 16. Appendix
16.1. About Us
16.2. Glossary of Terms
 Cross-segment Market Size and Analysis for
Mentioned Segments
Additional Company Profiles (Upto 5 With No Cost)
Additional Countries (Apart From Mentioned Countries)
Country/Region-specific Report
Go To Market Strategy
Region Specific Market DynamicsRegion Level Market Share Import Export AnalysisProduction AnalysisOthers
Cross-segment Market Size and Analysis for
Mentioned Segments
Additional Company Profiles (Upto 5 With No Cost)
Additional Countries (Apart From Mentioned Countries)
Country/Region-specific Report
Go To Market Strategy
Region Specific Market DynamicsRegion Level Market Share Import Export AnalysisProduction AnalysisOthers