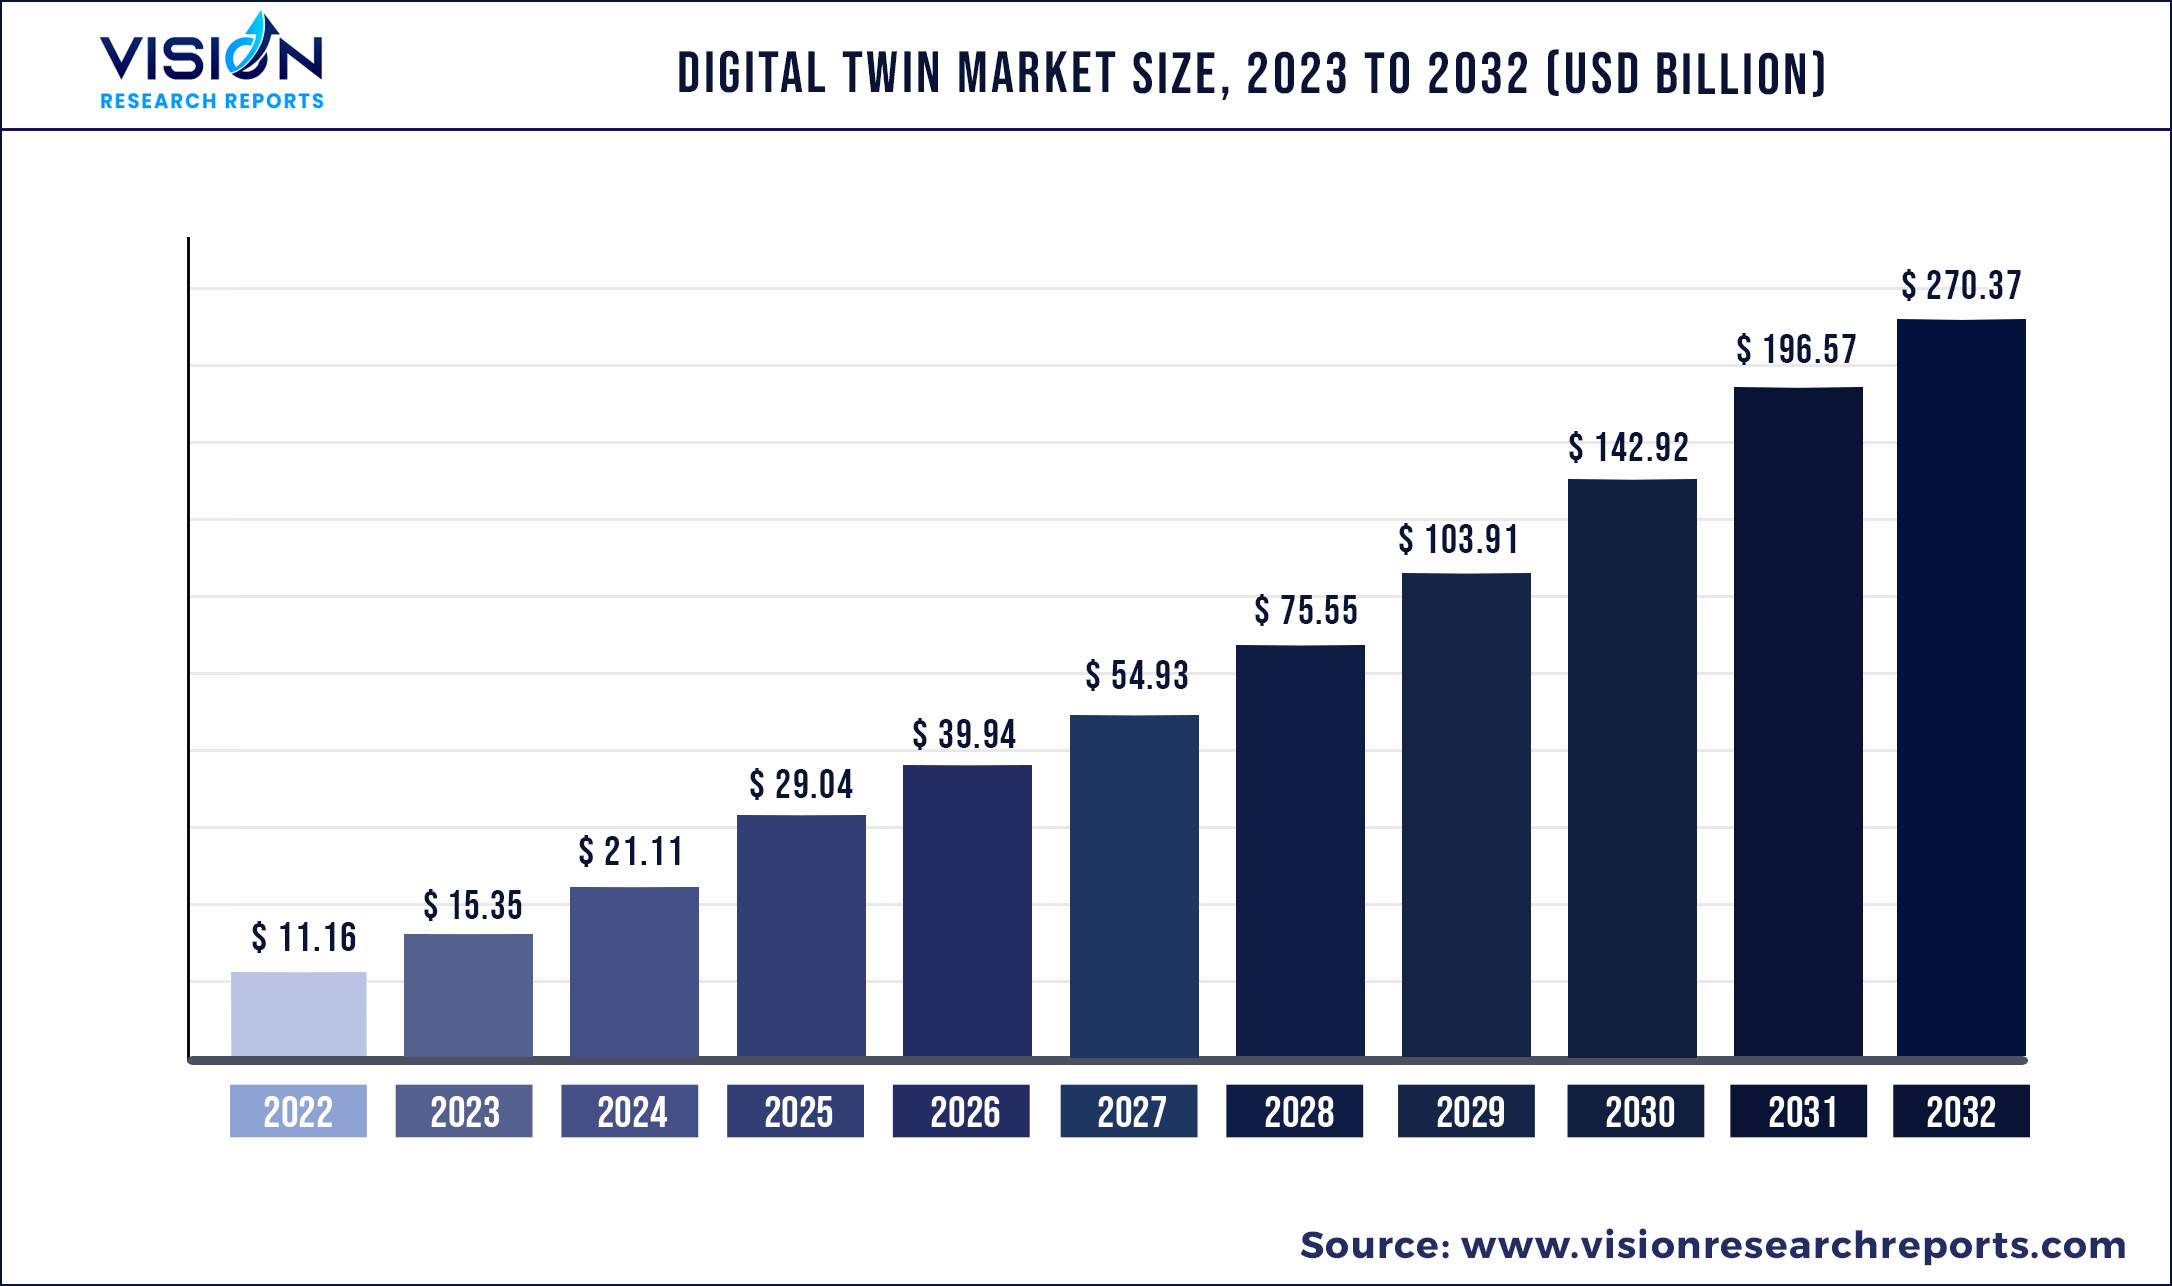
The global digital twin market size was estimated at around USD 11.16 billion in 2022 and it is projected to hit around USD 270.37 billion by 2032, growing at a CAGR of 37.54% from 2023 to 2032.
Key Pointers
Supply chain disruptions and production halts during the COVID-19 pandemic led to the suspension of several other activities along the value chain of industries such as manufacturing, aerospace, and automotive. This impacted the digital twin market during the first half of the pandemic in 2020. However, as the number of COVID-19 cases started reducing and restrictions were lifted, the digital twin market began recovering strongly as several industries started moving toward automation and virtualization of products as well as processes.
While the world is now on the path of recovery, a lot of uncertainty remains surrounding the spread of new COVID-19 variants. As such, several countries across the globe are expected to implement digital twin technology as a part of their economic activities. Digital twins facilitate the building of predictive models and help to examine the success before releasing physical prototypes The pandemic has accelerated the implementation of digital twin technology across applications in several verticals beyond manufacturing, including healthcare, real estate, telecom, and retail, fueling the market's development potential.
The installation of digital twin technology by combining with the latest technologies such as artificial intelligence, IoT, and cloud computing is further expected to boost the market growth. Organizations are deploying AI and IoT technologies to collect and interpret behavioral data from existing IoT devices and connected products, which can be later applied to the digital twin model to replicate the existing device’s usage and performance. This helps product engineers and designers observe the product performance and identify any issues as well as predict future iterations of common problems. The deployment of these technologies also aids organizations in enhancing operations and system productivity, thereby improving overall product performance.
Several organizations are focused on deploying digital twin solutions to optimize their supply chains and operational processes to recover from economic disruptions caused by the pandemic. As such, cloud companies such as Microsoft Azure and Google Cloud are focusing on launching various cloud-based digital twin solutions for industry players for easy accessibility and customized solutions. For instance, in January 2022, Google Cloud launched a supply chain digital twin, which aimed to provide distributors and manufacturers with unprecedented visibility of operations occurring in their supply chains. Such innovative solutions and the growing demand for automation in various industries are anticipated to trigger the demand for the digital twin platform in the forecast period.
Digital Twin Market Segmentations and Key Players:
| By End-use | By Solution | Key Players | Regions Segmentations |
|
Manufacturing Agriculture Automotive & Transport Energy & Utilities Healthcare & Life Sciences Residential & Commercial Retail & Consumer Goods Aerospace Telecommunication Others |
Component Process System |
ABB AVEVA Group plc Dassault Systemes General Electric Hexagon AB IBM Corporation SAP |
North America Europe Asia Pacific Latin America |
Chapter 1. Introduction
1.1. Research Objective
1.2. Scope of the Study
1.3. Definition
Chapter 2. Research Methodology
2.1. Research Approach
2.2. Data Sources
2.3. Assumptions & Limitations
Chapter 3. Executive Summary
3.1. Market Snapshot
Chapter 4. Market Variables and Scope
4.1. Introduction
4.2. Market Classification and Scope
4.3. Industry Value Chain Analysis
4.3.1. Raw Material Procurement Analysis
4.3.2. Sales and Distribution Channel Analysis
4.3.3. Downstream Buyer Analysis
Chapter 5. COVID 19 Impact on Digital Twin Market
5.1. COVID-19 Landscape: Digital Twin Industry Impact
5.2. COVID 19 - Impact Assessment for the Industry
5.3. COVID 19 Impact: Global Major Government Policy
5.4. Market Trends and Opportunities in the COVID-19 Landscape
Chapter 6. Market Dynamics Analysis and Trends
6.1. Market Dynamics
6.1.1. Market Drivers
6.1.2. Market Restraints
6.1.3. Market Opportunities
6.2. Porter’s Five Forces Analysis
6.2.1. Bargaining power of suppliers
6.2.2. Bargaining power of buyers
6.2.3. Threat of substitute
6.2.4. Threat of new entrants
6.2.5. Degree of competition
Chapter 7. Competitive Landscape
7.1.1. Company Market Share/Positioning Analysis
7.1.2. Key Strategies Adopted by Players
7.1.3. Vendor Landscape
7.1.3.1. List of Suppliers
7.1.3.2. List of Buyers
Chapter 8. Global Digital Twin Market, By End-use
8.1. Digital Twin Market, by End-use, 2023-2032
8.1.1. Manufacturing
8.1.1.1. Market Revenue and Forecast (2020-2032)
8.1.2. Agriculture
8.1.2.1. Market Revenue and Forecast (2020-2032)
8.1.3. Automotive & Transport
8.1.3.1. Market Revenue and Forecast (2020-2032)
8.1.4. Energy & Utilities
8.1.4.1. Market Revenue and Forecast (2020-2032)
8.1.5. Healthcare & Life Sciences
8.1.5.1. Market Revenue and Forecast (2020-2032)
8.1.6. Residential & Commercial
8.1.6.1. Market Revenue and Forecast (2020-2032)
8.1.7. Retail & Consumer Goods
8.1.7.1. Market Revenue and Forecast (2020-2032)
8.1.8. Aerospace
8.1.8.1. Market Revenue and Forecast (2020-2032)
8.1.9. Telecommunication
8.1.9.1. Market Revenue and Forecast (2020-2032)
8.1.10. Others
8.1.10.1. Market Revenue and Forecast (2020-2032)
Chapter 9. Global Digital Twin Market, By Solution
9.1. Digital Twin Market, by Solution, 2023-2032
9.1.1. Component
9.1.1.1. Market Revenue and Forecast (2020-2032)
9.1.2. Process
9.1.2.1. Market Revenue and Forecast (2020-2032)
9.1.3. System
9.1.3.1. Market Revenue and Forecast (2020-2032)
Chapter 10. Global Digital Twin Market, Regional Estimates and Trend Forecast
10.1. North America
10.1.1. Market Revenue and Forecast, by End-use (2020-2032)
10.1.2. Market Revenue and Forecast, by Solution (2020-2032)
10.1.3. U.S.
10.1.3.1. Market Revenue and Forecast, by End-use (2020-2032)
10.1.3.2. Market Revenue and Forecast, by Solution (2020-2032)
10.1.4. Rest of North America
10.1.4.1. Market Revenue and Forecast, by End-use (2020-2032)
10.1.4.2. Market Revenue and Forecast, by Solution (2020-2032)
10.2. Europe
10.2.1. Market Revenue and Forecast, by End-use (2020-2032)
10.2.2. Market Revenue and Forecast, by Solution (2020-2032)
10.2.3. UK
10.2.3.1. Market Revenue and Forecast, by End-use (2020-2032)
10.2.3.2. Market Revenue and Forecast, by Solution (2020-2032)
10.2.4. Germany
10.2.4.1. Market Revenue and Forecast, by End-use (2020-2032)
10.2.4.2. Market Revenue and Forecast, by Solution (2020-2032)
10.2.5. France
10.2.5.1. Market Revenue and Forecast, by End-use (2020-2032)
10.2.5.2. Market Revenue and Forecast, by Solution (2020-2032)
10.2.6. Rest of Europe
10.2.6.1. Market Revenue and Forecast, by End-use (2020-2032)
10.2.6.2. Market Revenue and Forecast, by Solution (2020-2032)
10.3. APAC
10.3.1. Market Revenue and Forecast, by End-use (2020-2032)
10.3.2. Market Revenue and Forecast, by Solution (2020-2032)
10.3.3. India
10.3.3.1. Market Revenue and Forecast, by End-use (2020-2032)
10.3.3.2. Market Revenue and Forecast, by Solution (2020-2032)
10.3.4. China
10.3.4.1. Market Revenue and Forecast, by End-use (2020-2032)
10.3.4.2. Market Revenue and Forecast, by Solution (2020-2032)
10.3.5. Japan
10.3.5.1. Market Revenue and Forecast, by End-use (2020-2032)
10.3.5.2. Market Revenue and Forecast, by Solution (2020-2032)
10.3.6. Rest of APAC
10.3.6.1. Market Revenue and Forecast, by End-use (2020-2032)
10.3.6.2. Market Revenue and Forecast, by Solution (2020-2032)
10.4. MEA
10.4.1. Market Revenue and Forecast, by End-use (2020-2032)
10.4.2. Market Revenue and Forecast, by Solution (2020-2032)
10.4.3. GCC
10.4.3.1. Market Revenue and Forecast, by End-use (2020-2032)
10.4.3.2. Market Revenue and Forecast, by Solution (2020-2032)
10.4.4. North Africa
10.4.4.1. Market Revenue and Forecast, by End-use (2020-2032)
10.4.4.2. Market Revenue and Forecast, by Solution (2020-2032)
10.4.5. South Africa
10.4.5.1. Market Revenue and Forecast, by End-use (2020-2032)
10.4.5.2. Market Revenue and Forecast, by Solution (2020-2032)
10.4.6. Rest of MEA
10.4.6.1. Market Revenue and Forecast, by End-use (2020-2032)
10.4.6.2. Market Revenue and Forecast, by Solution (2020-2032)
10.5. Latin America
10.5.1. Market Revenue and Forecast, by End-use (2020-2032)
10.5.2. Market Revenue and Forecast, by Solution (2020-2032)
10.5.3. Brazil
10.5.3.1. Market Revenue and Forecast, by End-use (2020-2032)
10.5.3.2. Market Revenue and Forecast, by Solution (2020-2032)
10.5.4. Rest of LATAM
10.5.4.1. Market Revenue and Forecast, by End-use (2020-2032)
10.5.4.2. Market Revenue and Forecast, by Solution (2020-2032)
Chapter 11. Company Profiles
11.1. ABB
11.1.1. Company Overview
11.1.2. Product Offerings
11.1.3. Financial Performance
11.1.4. Recent Initiatives
11.2. AVEVA Group plc
11.2.1. Company Overview
11.2.2. Product Offerings
11.2.3. Financial Performance
11.2.4. Recent Initiatives
11.3. Dassault Systemes
11.3.1. Company Overview
11.3.2. Product Offerings
11.3.3. Financial Performance
11.3.4. Recent Initiatives
11.4. General Electric
11.4.1. Company Overview
11.4.2. Product Offerings
11.4.3. Financial Performance
11.4.4. LTE Scientific
11.5. Hexagon AB
11.5.1. Company Overview
11.5.2. Product Offerings
11.5.3. Financial Performance
11.5.4. Recent Initiatives
11.6. IBM Corporation
11.6.1. Company Overview
11.6.2. Product Offerings
11.6.3. Financial Performance
11.6.4. Recent Initiatives
11.7. SAP
11.7.1. Company Overview
11.7.2. Product Offerings
11.7.3. Financial Performance
11.7.4. Recent Initiatives
Chapter 12. Research Methodology
12.1. Primary Research
12.2. Secondary Research
12.3. Assumptions
Chapter 13. Appendix
13.1. About Us
13.2. Glossary of Terms
 Cross-segment Market Size and Analysis for
Mentioned Segments
Additional Company Profiles (Upto 5 With No Cost)
Additional Countries (Apart From Mentioned Countries)
Country/Region-specific Report
Go To Market Strategy
Region Specific Market DynamicsRegion Level Market Share Import Export AnalysisProduction AnalysisOthers
Cross-segment Market Size and Analysis for
Mentioned Segments
Additional Company Profiles (Upto 5 With No Cost)
Additional Countries (Apart From Mentioned Countries)
Country/Region-specific Report
Go To Market Strategy
Region Specific Market DynamicsRegion Level Market Share Import Export AnalysisProduction AnalysisOthers