Fertilizer Market Size, Share, Growth, Trends, Forecast 2023-2032
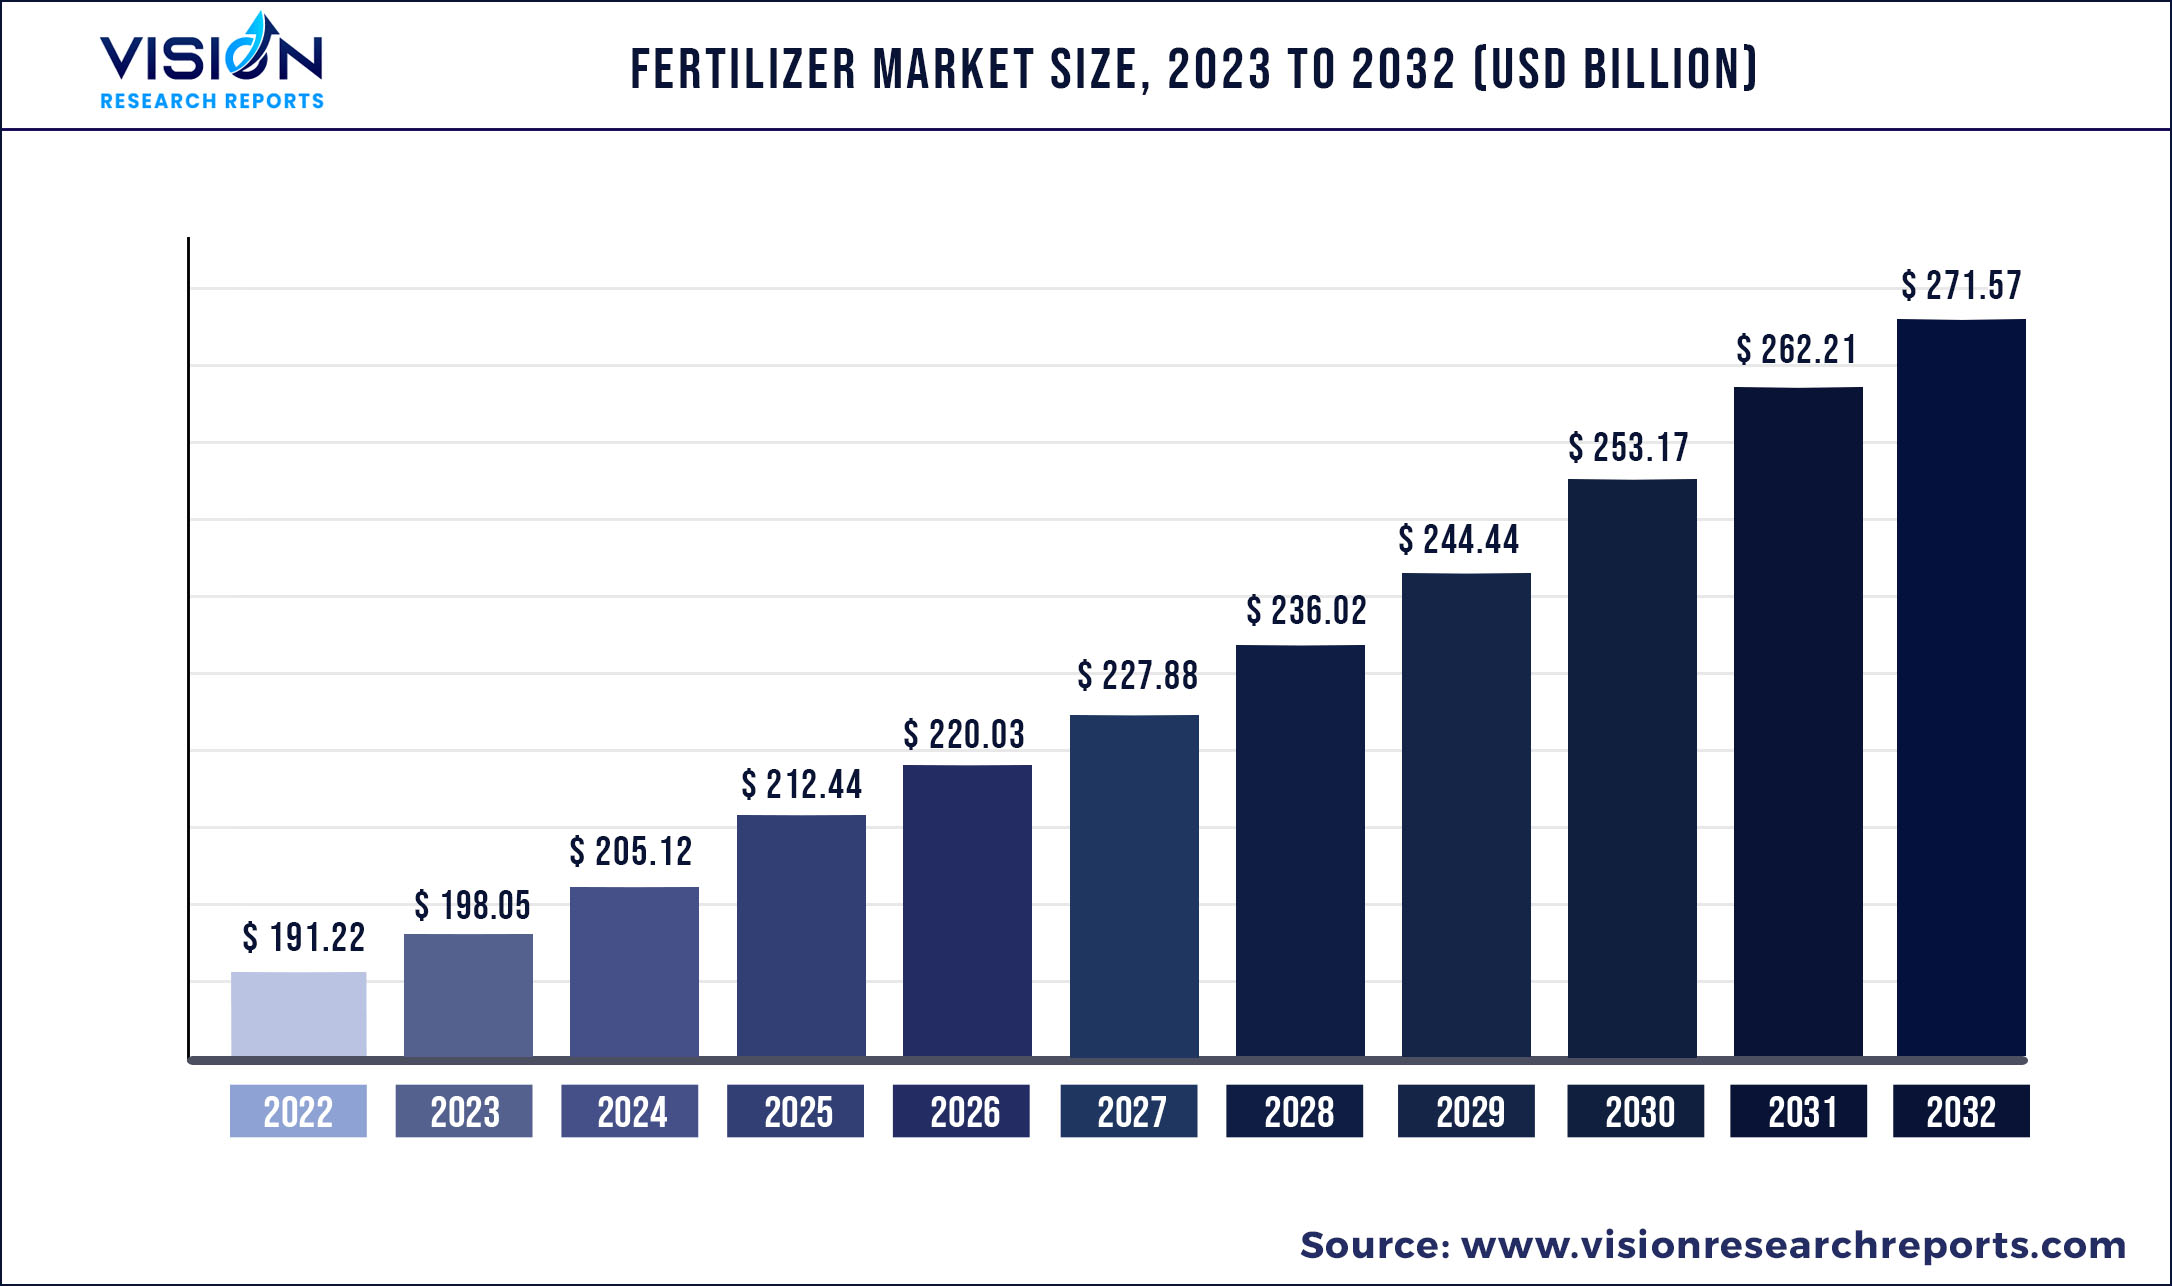
The global fertilizer market was surpassed at USD 191.22 billion in 2022 and is expected to hit around USD 271.57 billion by 2032, growing at a CAGR of 3.57% from 2023 to 2032.
Key Pointers
| Report Coverage | Details |
| Market Size in 2022 | USD 191.22 billion |
| Revenue Forecast by 2032 | USD 271.57 billion |
| Growth rate from 2023 to 2032 | CAGR of 3.57% |
| Base Year | 2022 |
| Forecast Period | 2023 to 2032 |
| Regions Covered | North America, Europe, Asia Pacific, Latin America, Middle East & Africa |
| Companies Covered | Yara International, Nutrien Ltd., The Mosaic Company, Haifa Group, Syngenta AG, ICL Group Ltd., EuroChem Group, OCP Group S.A., K+S Aktiengesellschaft, Uralkali |
Fertilizer market is gaining huge popularity as it plays a crucial role in improving the crop yield by providing essential nutrients to the crops such as nitrogen, phosphate, potassium, and others that improves the soil fertility. The demand for fertilizers, especially in agriculture sector has increased rapidly as growing population has led to an increase in the demand for food. In addition, lack of nutrients in soil due to use of pesticides and other harmful chemicals has led to decline in agricultural productivity. This is expected to increase the demand for fertilizers. Moreover, fertilizer sector is fragmented with various fertilizer companies operating around the world. Because fertilizers are such a crucial instrument for increasing agricultural output, industry participants are forming strategic alliances and joint ventures to expand their geographic footprint and product portfolio. For example, in 2019, the Haifa Group announced that they have expanded their Controlled Release Fertilizer (CRF) factory in France for producing 8,000 MTPA. Using this technology, the company was able to increase its manufacturing capacity by up to 24,000 MTPA. In 2018, Yara International ASA paid USD 255 billion for Brazil's Vale Cubatao Fertilizantes Complex. As a result of this strategy, the company was able to strengthen its nitrogen production assets and market position in the Brazilian fertilizer industry.
However, the lack of awareness regarding optimum use of fertilizers is anticipated to restrain the market growth. For instance, optimum use of chemical fertilizers is a cost-effective way to boost the crop yield. However, overuse of chemical fertilizers degrades the soil as it disrupts the acidity of soil which is detrimental to the crop and surrounding.
According to regional analysis, the Asia-Pacific fertilizer market accounted for $99.13 billion in 2021 and is predicted to grow with a CAGR of 3.76%, in the projected timeframe owing to rising fertilizer demand across the region. Several countries in the region are looking to export agricultural products around the world in order to grow their economies.
Fertilizer Market Overview
Fertilizers derived from organic or inorganic origin and are applied to the soil or plant tissue to increase the crop productivity, by supplying nutrients essential for the plant growth. For instance, nitrogen-based fertilizers contain nitrogen which is the main constituent of chlorophyll that facilitates photosynthesis process in plants. Phosphorous fertilizers are beneficial for the roots of plants as phosphorous is present in protoplasm of cell that promotes cell growth and proliferation. In addition, organic fertilizers are natural fertilizers obtained from agricultural waste, industrial waste, municipal sludge, or livestock manure. These fertilizers promote reproduction of microorganisms, enhance the physical & chemical properties of soil, and enhance the water retention capacity of the soil.
Moreover. fertilizers are chemical compounds that are applied to plant tissues or soil to provide one or more nutrients required for plant growth. Higher crop yields are encouraged while soil nutrient availability is maintained and increased. The usage of organic fertilizers has risen, allowing farmers to utilize fertilizers more safely and efficiently while reducing the risk of toxic fertilizer exposure.
Fertilizer Market Segmentations:
| By Type | By Form | By Application |
|
Organic Inorganic |
Dry Liquid |
Agriculture Horticulture Gardening Others |
Chapter 1. Introduction
1.1. Research Objective
1.2. Scope of the Study
1.3. Definition
Chapter 2. Research Methodology
2.1. Research Approach
2.2. Data Sources
2.3. Assumptions & Limitations
Chapter 3. Executive Summary
3.1. Market Snapshot
Chapter 4. Market Variables and Scope
4.1. Introduction
4.2. Market Classification and Scope
4.3. Industry Value Chain Analysis
4.3.1. Raw Material Procurement Analysis
4.3.2. Sales and Distribution Channel Analysis
4.3.3. Downstream Buyer Analysis
Chapter 5. COVID 19 Impact on Fertilizer Market
5.1. COVID-19 Landscape: Fertilizer Industry Impact
5.2. COVID 19 - Impact Assessment for the Industry
5.3. COVID 19 Impact: Global Major Government Policy
5.4. Market Trends and Opportunities in the COVID-19 Landscape
Chapter 6. Market Dynamics Analysis and Trends
6.1. Market Dynamics
6.1.1. Market Drivers
6.1.2. Market Restraints
6.1.3. Market Opportunities
6.2. Porter’s Five Forces Analysis
6.2.1. Bargaining power of suppliers
6.2.2. Bargaining power of buyers
6.2.3. Threat of substitute
6.2.4. Threat of new entrants
6.2.5. Degree of competition
Chapter 7. Competitive Landscape
7.1.1. Company Market Share/Positioning Analysis
7.1.2. Key Strategies Adopted by Players
7.1.3. Vendor Landscape
7.1.3.1. List of Suppliers
7.1.3.2. List of Buyers
Chapter 8. Global Fertilizer Market, By Type
8.1. Fertilizer Market, by Type, 2023-2032
8.1.1 Organic
8.1.1.1. Market Revenue and Forecast (2020-2032)
8.1.2. Inorganic
8.1.2.1. Market Revenue and Forecast (2020-2032)
Chapter 9. Global Fertilizer Market, By Form
9.1. Fertilizer Market, by Form, 2023-2032
9.1.1. Dry
9.1.1.1. Market Revenue and Forecast (2020-2032)
9.1.2. Liquid
9.1.2.1. Market Revenue and Forecast (2020-2032)
Chapter 10. Global Fertilizer Market, By Application
10.1. Fertilizer Market, by Application, 2023-2032
10.1.1. Agriculture
10.1.1.1. Market Revenue and Forecast (2020-2032)
10.1.2. Horticulture
10.1.2.1. Market Revenue and Forecast (2020-2032)
10.1.3. Gardening
10.1.3.1. Market Revenue and Forecast (2020-2032)
10.1.4. Others
10.1.4.1. Market Revenue and Forecast (2020-2032)
Chapter 11. Global Fertilizer Market, Regional Estimates and Trend Forecast
11.1. North America
11.1.1. Market Revenue and Forecast, by Type (2020-2032)
11.1.2. Market Revenue and Forecast, by Form (2020-2032)
11.1.3. Market Revenue and Forecast, by Application (2020-2032)
11.1.4. U.S.
11.1.4.1. Market Revenue and Forecast, by Type (2020-2032)
11.1.4.2. Market Revenue and Forecast, by Form (2020-2032)
11.1.4.3. Market Revenue and Forecast, by Application (2020-2032)
11.1.5. Rest of North America
11.1.5.1. Market Revenue and Forecast, by Type (2020-2032)
11.1.5.2. Market Revenue and Forecast, by Form (2020-2032)
11.1.5.3. Market Revenue and Forecast, by Application (2020-2032)
11.2. Europe
11.2.1. Market Revenue and Forecast, by Type (2020-2032)
11.2.2. Market Revenue and Forecast, by Form (2020-2032)
11.2.3. Market Revenue and Forecast, by Application (2020-2032)
11.2.4. UK
11.2.4.1. Market Revenue and Forecast, by Type (2020-2032)
11.2.4.2. Market Revenue and Forecast, by Form (2020-2032)
11.2.4.3. Market Revenue and Forecast, by Application (2020-2032)
11.2.5. Germany
11.2.5.1. Market Revenue and Forecast, by Type (2020-2032)
11.2.5.2. Market Revenue and Forecast, by Form (2020-2032)
11.2.5.3. Market Revenue and Forecast, by Application (2020-2032)
11.2.6. France
11.2.6.1. Market Revenue and Forecast, by Type (2020-2032)
11.2.6.2. Market Revenue and Forecast, by Form (2020-2032)
11.2.6.3. Market Revenue and Forecast, by Application (2020-2032)
11.2.7. Rest of Europe
11.2.7.1. Market Revenue and Forecast, by Type (2020-2032)
11.2.7.2. Market Revenue and Forecast, by Form (2020-2032)
11.2.7.3. Market Revenue and Forecast, by Application (2020-2032)
11.3. APAC
11.3.1. Market Revenue and Forecast, by Type (2020-2032)
11.3.2. Market Revenue and Forecast, by Form (2020-2032)
11.3.3. Market Revenue and Forecast, by Application (2020-2032)
11.3.4. India
11.3.4.1. Market Revenue and Forecast, by Type (2020-2032)
11.3.4.2. Market Revenue and Forecast, by Form (2020-2032)
11.3.4.3. Market Revenue and Forecast, by Application (2020-2032)
11.3.5. China
11.3.5.1. Market Revenue and Forecast, by Type (2020-2032)
11.3.5.2. Market Revenue and Forecast, by Form (2020-2032)
11.3.5.3. Market Revenue and Forecast, by Application (2020-2032)
11.3.6. Japan
11.3.6.1. Market Revenue and Forecast, by Type (2020-2032)
11.3.6.2. Market Revenue and Forecast, by Form (2020-2032)
11.3.6.3. Market Revenue and Forecast, by Application (2020-2032)
11.3.7. Rest of APAC
11.3.7.1. Market Revenue and Forecast, by Type (2020-2032)
11.3.7.2. Market Revenue and Forecast, by Form (2020-2032)
11.3.7.3. Market Revenue and Forecast, by Application (2020-2032)
11.4. MEA
11.4.1. Market Revenue and Forecast, by Type (2020-2032)
11.4.2. Market Revenue and Forecast, by Form (2020-2032)
11.4.3. Market Revenue and Forecast, by Application (2020-2032)
11.4.4. GCC
11.4.4.1. Market Revenue and Forecast, by Type (2020-2032)
11.4.4.2. Market Revenue and Forecast, by Form (2020-2032)
11.4.4.3. Market Revenue and Forecast, by Application (2020-2032)
11.4.5. North Africa
11.4.5.1. Market Revenue and Forecast, by Type (2020-2032)
11.4.5.2. Market Revenue and Forecast, by Form (2020-2032)
11.4.5.3. Market Revenue and Forecast, by Application (2020-2032)
11.4.6. South Africa
11.4.6.1. Market Revenue and Forecast, by Type (2020-2032)
11.4.6.2. Market Revenue and Forecast, by Form (2020-2032)
11.4.6.3. Market Revenue and Forecast, by Application (2020-2032)
11.4.7. Rest of MEA
11.4.7.1. Market Revenue and Forecast, by Type (2020-2032)
11.4.7.2. Market Revenue and Forecast, by Form (2020-2032)
11.4.7.3. Market Revenue and Forecast, by Application (2020-2032)
11.5. Latin America
11.5.1. Market Revenue and Forecast, by Type (2020-2032)
11.5.2. Market Revenue and Forecast, by Form (2020-2032)
11.5.3. Market Revenue and Forecast, by Application (2020-2032)
11.5.4. Brazil
11.5.4.1. Market Revenue and Forecast, by Type (2020-2032)
11.5.4.2. Market Revenue and Forecast, by Form (2020-2032)
11.5.4.3. Market Revenue and Forecast, by Application (2020-2032)
11.5.5. Rest of LATAM
11.5.5.1. Market Revenue and Forecast, by Type (2020-2032)
11.5.5.2. Market Revenue and Forecast, by Form (2020-2032)
11.5.5.3. Market Revenue and Forecast, by Application (2020-2032)
Chapter 12. Company Profiles
12.1. Yara International
12.1.1. Company Overview
12.1.2. Product Offerings
12.1.3. Financial Performance
12.1.4. Recent Initiatives
12.2. Nutrien Ltd.
12.2.1. Company Overview
12.2.2. Product Offerings
12.2.3. Financial Performance
12.2.4. Recent Initiatives
12.3. The Mosaic Company
12.3.1. Company Overview
12.3.2. Product Offerings
12.3.3. Financial Performance
12.3.4. Recent Initiatives
12.4. Haifa Group
12.4.1. Company Overview
12.4.2. Product Offerings
12.4.3. Financial Performance
12.4.4. Recent Initiatives
12.5. Syngenta AG
12.5.1. Company Overview
12.5.2. Product Offerings
12.5.3. Financial Performance
12.5.4. Recent Initiatives
12.6. ICL Group Ltd.
12.6.1. Company Overview
12.6.2. Product Offerings
12.6.3. Financial Performance
12.6.4. Recent Initiatives
12.7. EuroChem Group
12.7.1. Company Overview
12.7.2. Product Offerings
12.7.3. Financial Performance
12.7.4. Recent Initiatives
12.8. OCP Group S.A.
12.8.1. Company Overview
12.8.2. Product Offerings
12.8.3. Financial Performance
12.8.4. Recent Initiatives
12.9. K+S Aktiengesellschaft
12.9.1. Company Overview
12.9.2. Product Offerings
12.9.3. Financial Performance
12.9.4. Recent Initiatives
12.10. Uralkali
12.10.1. Company Overview
12.10.2. Product Offerings
12.10.3. Financial Performance
12.10.4. Recent Initiatives
Chapter 13. Research Methodology
13.1. Primary Research
13.2. Secondary Research
13.3. Assumptions
Chapter 14. Appendix
14.1. About Us
14.2. Glossary of Terms
 Cross-segment Market Size and Analysis for
Mentioned Segments
Additional Company Profiles (Upto 5 With No Cost)
Additional Countries (Apart From Mentioned Countries)
Country/Region-specific Report
Go To Market Strategy
Region Specific Market DynamicsRegion Level Market Share Import Export AnalysisProduction AnalysisOthers
Cross-segment Market Size and Analysis for
Mentioned Segments
Additional Company Profiles (Upto 5 With No Cost)
Additional Countries (Apart From Mentioned Countries)
Country/Region-specific Report
Go To Market Strategy
Region Specific Market DynamicsRegion Level Market Share Import Export AnalysisProduction AnalysisOthers