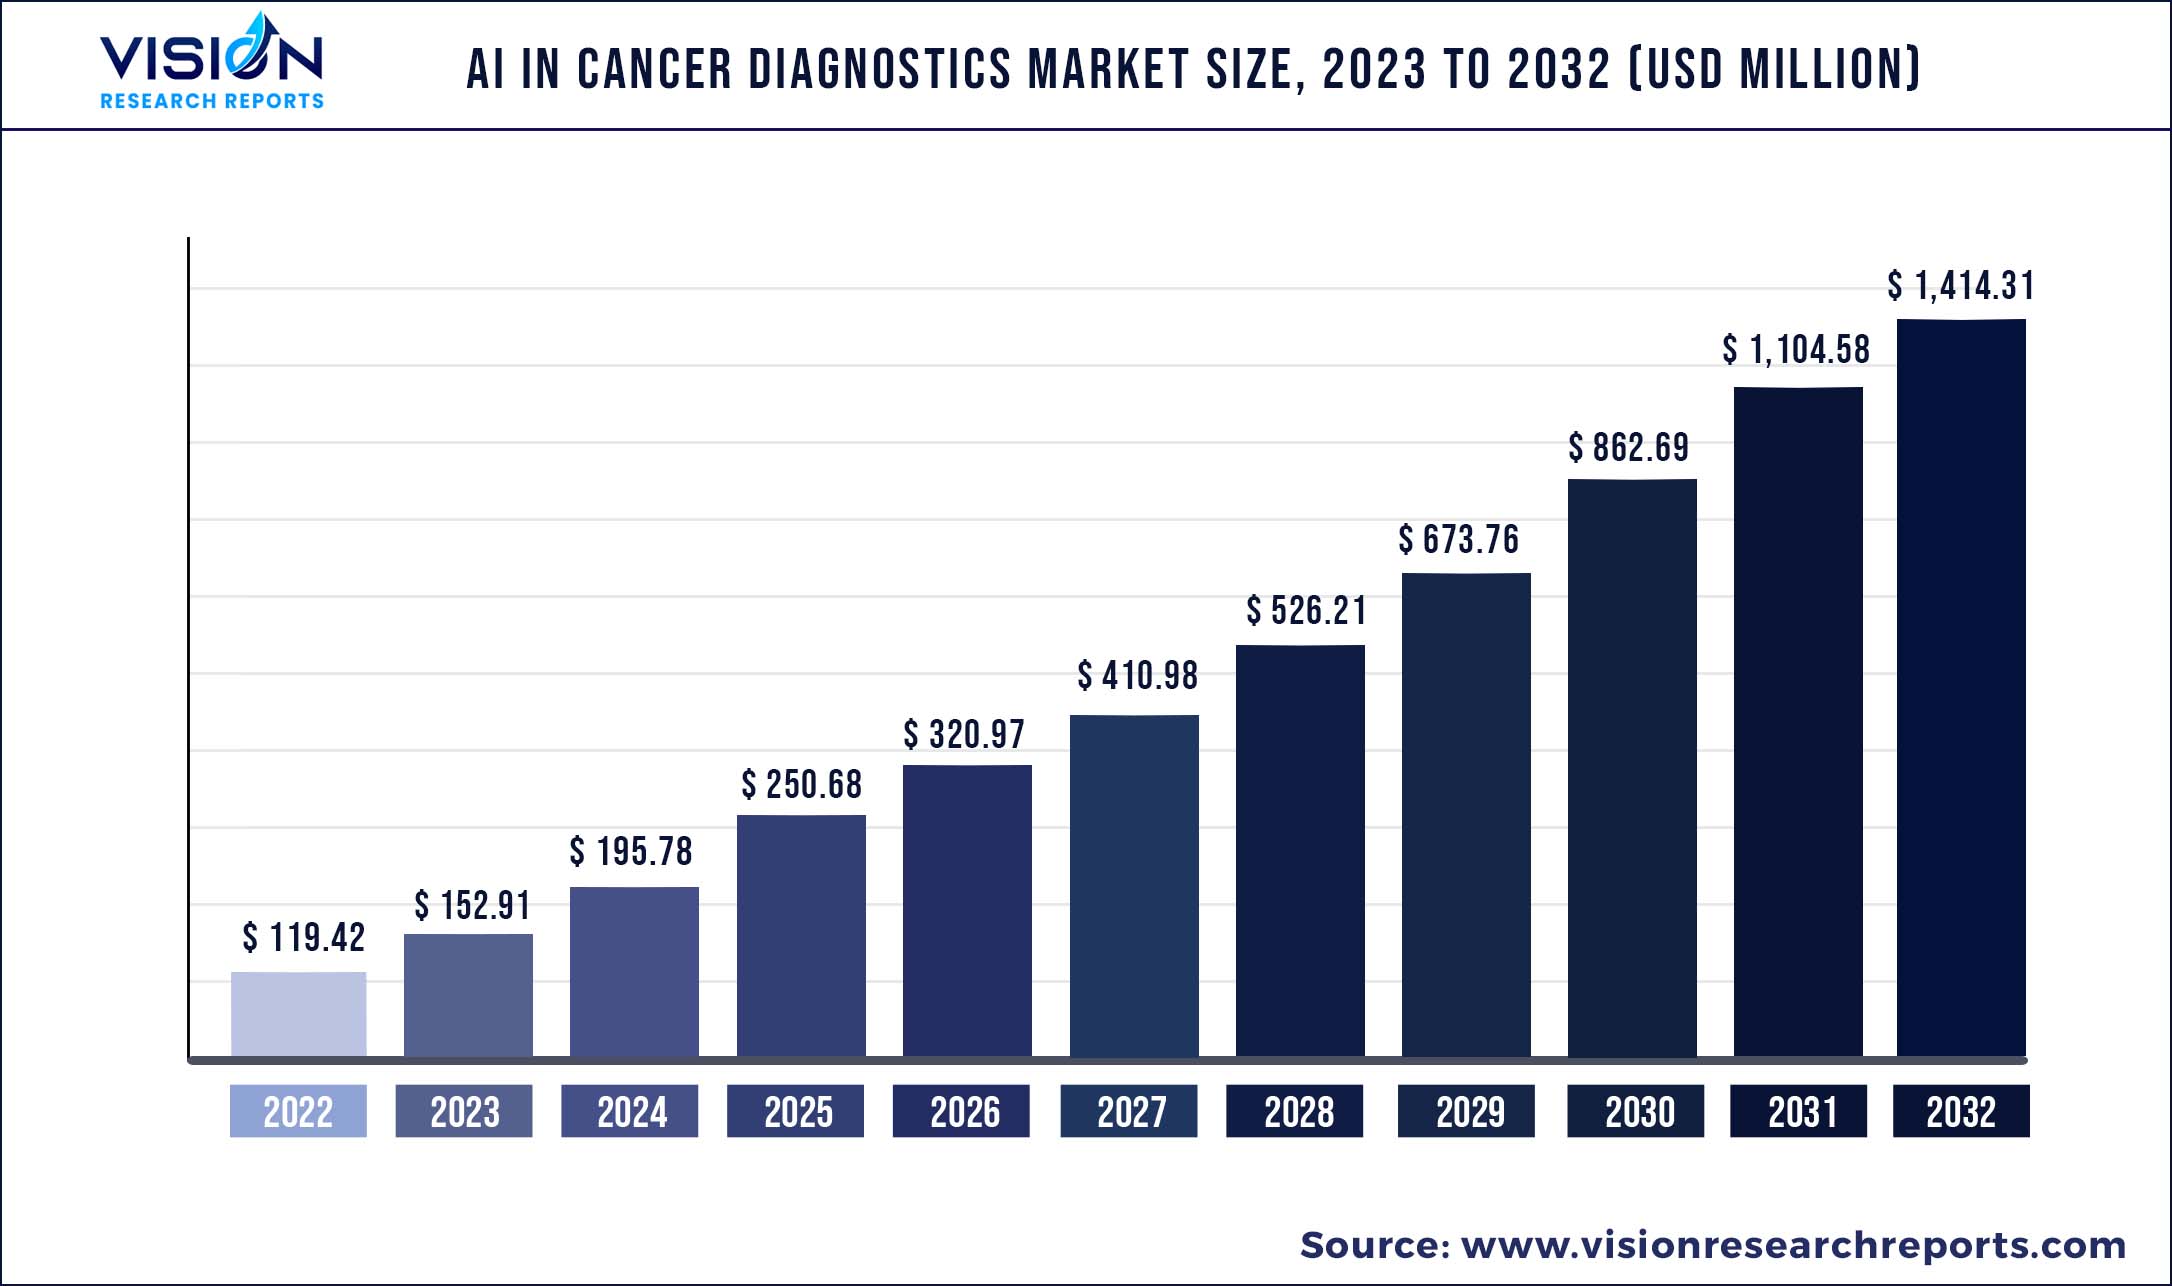
The global AI in cancer diagnostics market was valued at USD 119.42 million in 2022 and it is predicted to surpass around USD 1,414.31 million by 2032 with a CAGR of 28.04% from 2023 to 2032.
The global AI in cancer diagnostics market was valued at USD 119.42 million in 2022 and it is predicted to surpass around USD 1,414.31 million by 2032 with a CAGR of 28.04% from 2023 to 2032.
Key Pointers
Report Scope of the AI In Cancer Diagnostics Market
| Report Coverage | Details |
| Market Size in 2022 | USD 119.42 million |
| Revenue Forecast by 2032 | USD 1,414.31 million |
| Growth rate from 2023 to 2032 | CAGR of 28.04% |
| Base Year | 2022 |
| Forecast Period | 2023 to 2032 |
| Regions Covered | North America, Europe, Asia Pacific, Latin America, Middle East & Africa |
| Companies Covered | EarlySign; Cancer Center.ai; Microsoft; Flatiron; Path AI; Therapixel; Tempus; Paige AI, Inc.; Kheiron Medical Technologies Limited; SkinVision |
Artificial Intelligence (AI) in cancer diagnostics helps in the early diagnosis of cancer, which is expected to be a key factor driving the market. Cancer is a leading cause of death globally and it accounted for about 10 million deaths in 2020, according to the WHO. Most of these deaths can be prevented if the cancer is detected early. Early detection of cancer is possible through the use of AI for screening and diagnosis of cancer, which is expected to boost the market growth. The AI/ML models analyze images generated through pathology and radiology, which helps in the precise diagnosis of cancer as compared to the doctors who generally rely on the observations made through their experience. For instance, in 2019, a team of researchers from the National Institutes of Health and Global Good developed an AI algorithm, which helps in analyzing digital images of women’s cervix and identifying accurately precancerous changes that may be potentially cancerous.
Rising healthcare IT expenditure by countries globally is expected to positively contribute to market growth. The rising expenditure is expected to help improve the digital infrastructure, which is expected to boost the adoption of AI in hospitals and other healthcare institutes. For instance, according to an article by pharmaceutical technology dated November 2021, the number of AI-related financing deals in life sciences jumped from 14 in Q1 of 2019 to 56 in Q1 of 2021. Moreover, AI helps in the accurate and early detection of cancer and reduction in the cost of treatment considerably. According to an article by Lancet dated June 2022, the implementation of AI detection during screening colonoscopy helped to prevent 7194 colorectal cancer cases and 2089 deaths in 2022. The article also states that the implementation of AI for detection also helped to save USD 290 million in 2022.
A shortage of healthcare professionals is expected to boost the adoption of AI software and solutions. Moreover, increasing penetration of AI for diagnostic purposes and initiatives undertaken by the key market players are expected to boost the growth of the market. For instance, in June 2022, Varian, a subsidiary of Siemens Healthineers, partnered with the state and central governments in India under the public-private partnership strategy to set up radiation centers in the states having higher cancer rates.
Availability of data is a key factor for precise diagnosis. In cases of the unavailability of sufficient data, the AI models can make an incorrect diagnosis, which is expected to be a key restraint for the market. Moreover, the AI models rely on information gathered from patients who had comparable circumstances and symptoms, which may act as a barrier for the patients having unrelated symptoms, thereby affecting the accuracy of the diagnosis. Further, the reliance on AI models on data networks makes them vulnerable to cyberattacks, which is expected to negatively affect market growth. For instance, according to an article by Technology Networks dated December 2021, AI models are vulnerable to cyberattacks and can cause the AI models to deliver false results, which affects patient safety.
AI In Cancer Diagnostics Market Segmentations:
| By Component | By Cancer Type | By End-user |
|
Software Solutions Hardware Services |
Breast Cancer Lung Cancer Prostate Cancer Colorectal Cancer Brain Tumor Others |
Hospital Surgical Centers and Medical Institutes Others |
Chapter 1. Introduction
1.1. Research Objective
1.2. Scope of the Study
1.3. Definition
Chapter 2. Research Methodology
2.1. Research Approach
2.2. Data Sources
2.3. Assumptions & Limitations
Chapter 3. Executive Summary
3.1. Market Snapshot
Chapter 4. Market Variables and Scope
4.1. Introduction
4.2. Market Classification and Scope
4.3. Industry Value Chain Analysis
4.3.1. Raw Material Procurement Analysis
4.3.2. Sales and Distribution Component Analysis
4.3.3. Downstream Buyer Analysis
Chapter 5. COVID 19 Impact on AI In Cancer Diagnostics Market
5.1. COVID-19 Landscape: AI In Cancer Diagnostics Industry Impact
5.2. COVID 19 - Impact Assessment for the Industry
5.3. COVID 19 Impact: Global Major Government Policy
5.4. Market Trends and Opportunities in the COVID-19 Landscape
Chapter 6. Market Dynamics Analysis and Trends
6.1. Market Dynamics
6.1.1. Market Drivers
6.1.2. Market Restraints
6.1.3. Market Opportunities
6.2. Porter’s Five Forces Analysis
6.2.1. Bargaining power of suppliers
6.2.2. Bargaining power of buyers
6.2.3. Threat of substitute
6.2.4. Threat of new entrants
6.2.5. Degree of competition
Chapter 7. Competitive Landscape
7.1.1. Company Market Share/Positioning Analysis
7.1.2. Key Strategies Adopted by Players
7.1.3. Vendor Landscape
7.1.3.1. List of Suppliers
7.1.3.2. List of Buyers
Chapter 8. Global AI In Cancer Diagnostics Market, By Component
8.1. AI In Cancer Diagnostics Market, by Component, 2023-2032
8.1.1 Software Solutions
8.1.1.1. Market Revenue and Forecast (2020-2032)
8.1.2. Hardware
8.1.2.1. Market Revenue and Forecast (2020-2032)
8.1.3. Services
8.1.3.1. Market Revenue and Forecast (2020-2032)
Chapter 9. Global AI In Cancer Diagnostics Market, By Cancer Type
9.1. AI In Cancer Diagnostics Market, by Cancer Type, 2023-2032
9.1.1. Breast Cancer
9.1.1.1. Market Revenue and Forecast (2020-2032)
9.1.2. Lung Cancer
9.1.2.1. Market Revenue and Forecast (2020-2032)
9.1.3. Prostate Cancer
9.1.3.1. Market Revenue and Forecast (2020-2032)
9.1.4. Colorectal Cancer
9.1.4.1. Market Revenue and Forecast (2020-2032)
9.1.5. Brain Tumor
9.1.5.1. Market Revenue and Forecast (2020-2032)
9.1.6. Others
9.1.6.1. Market Revenue and Forecast (2020-2032)
Chapter 10. Global AI In Cancer Diagnostics Market, By End-user
10.1. AI In Cancer Diagnostics Market, by End-user, 2023-2032
10.1.1. Hospital
10.1.1.1. Market Revenue and Forecast (2020-2032)
10.1.2. Surgical Centers and Medical Institutes
10.1.2.1. Market Revenue and Forecast (2020-2032)
10.1.3. Others
10.1.3.1. Market Revenue and Forecast (2020-2032)
Chapter 11. Global AI In Cancer Diagnostics Market, Regional Estimates and Trend Forecast
11.1. North America
11.1.1. Market Revenue and Forecast, by Component (2020-2032)
11.1.2. Market Revenue and Forecast, by Cancer Type (2020-2032)
11.1.3. Market Revenue and Forecast, by End-user (2020-2032)
11.1.4. U.S.
11.1.4.1. Market Revenue and Forecast, by Component (2020-2032)
11.1.4.2. Market Revenue and Forecast, by Cancer Type (2020-2032)
11.1.4.3. Market Revenue and Forecast, by End-user (2020-2032)
11.1.5. Rest of North America
11.1.5.1. Market Revenue and Forecast, by Component (2020-2032)
11.1.5.2. Market Revenue and Forecast, by Cancer Type (2020-2032)
11.1.5.3. Market Revenue and Forecast, by End-user (2020-2032)
11.2. Europe
11.2.1. Market Revenue and Forecast, by Component (2020-2032)
11.2.2. Market Revenue and Forecast, by Cancer Type (2020-2032)
11.2.3. Market Revenue and Forecast, by End-user (2020-2032)
11.2.4. UK
11.2.4.1. Market Revenue and Forecast, by Component (2020-2032)
11.2.4.2. Market Revenue and Forecast, by Cancer Type (2020-2032)
11.2.4.3. Market Revenue and Forecast, by End-user (2020-2032)
11.2.5. Germany
11.2.5.1. Market Revenue and Forecast, by Component (2020-2032)
11.2.5.2. Market Revenue and Forecast, by Cancer Type (2020-2032)
11.2.5.3. Market Revenue and Forecast, by End-user (2020-2032)
11.2.6. France
11.2.6.1. Market Revenue and Forecast, by Component (2020-2032)
11.2.6.2. Market Revenue and Forecast, by Cancer Type (2020-2032)
11.2.6.3. Market Revenue and Forecast, by End-user (2020-2032)
11.2.7. Rest of Europe
11.2.7.1. Market Revenue and Forecast, by Component (2020-2032)
11.2.7.2. Market Revenue and Forecast, by Cancer Type (2020-2032)
11.2.7.3. Market Revenue and Forecast, by End-user (2020-2032)
11.3. APAC
11.3.1. Market Revenue and Forecast, by Component (2020-2032)
11.3.2. Market Revenue and Forecast, by Cancer Type (2020-2032)
11.3.3. Market Revenue and Forecast, by End-user (2020-2032)
11.3.4. India
11.3.4.1. Market Revenue and Forecast, by Component (2020-2032)
11.3.4.2. Market Revenue and Forecast, by Cancer Type (2020-2032)
11.3.4.3. Market Revenue and Forecast, by End-user (2020-2032)
11.3.5. China
11.3.5.1. Market Revenue and Forecast, by Component (2020-2032)
11.3.5.2. Market Revenue and Forecast, by Cancer Type (2020-2032)
11.3.5.3. Market Revenue and Forecast, by End-user (2020-2032)
11.3.6. Japan
11.3.6.1. Market Revenue and Forecast, by Component (2020-2032)
11.3.6.2. Market Revenue and Forecast, by Cancer Type (2020-2032)
11.3.6.3. Market Revenue and Forecast, by End-user (2020-2032)
11.3.7. Rest of APAC
11.3.7.1. Market Revenue and Forecast, by Component (2020-2032)
11.3.7.2. Market Revenue and Forecast, by Cancer Type (2020-2032)
11.3.7.3. Market Revenue and Forecast, by End-user (2020-2032)
11.4. MEA
11.4.1. Market Revenue and Forecast, by Component (2020-2032)
11.4.2. Market Revenue and Forecast, by Cancer Type (2020-2032)
11.4.3. Market Revenue and Forecast, by End-user (2020-2032)
11.4.4. GCC
11.4.4.1. Market Revenue and Forecast, by Component (2020-2032)
11.4.4.2. Market Revenue and Forecast, by Cancer Type (2020-2032)
11.4.4.3. Market Revenue and Forecast, by End-user (2020-2032)
11.4.5. North Africa
11.4.5.1. Market Revenue and Forecast, by Component (2020-2032)
11.4.5.2. Market Revenue and Forecast, by Cancer Type (2020-2032)
11.4.5.3. Market Revenue and Forecast, by End-user (2020-2032)
11.4.6. South Africa
11.4.6.1. Market Revenue and Forecast, by Component (2020-2032)
11.4.6.2. Market Revenue and Forecast, by Cancer Type (2020-2032)
11.4.6.3. Market Revenue and Forecast, by End-user (2020-2032)
11.4.7. Rest of MEA
11.4.7.1. Market Revenue and Forecast, by Component (2020-2032)
11.4.7.2. Market Revenue and Forecast, by Cancer Type (2020-2032)
11.4.7.3. Market Revenue and Forecast, by End-user (2020-2032)
11.5. Latin America
11.5.1. Market Revenue and Forecast, by Component (2020-2032)
11.5.2. Market Revenue and Forecast, by Cancer Type (2020-2032)
11.5.3. Market Revenue and Forecast, by End-user (2020-2032)
11.5.4. Brazil
11.5.4.1. Market Revenue and Forecast, by Component (2020-2032)
11.5.4.2. Market Revenue and Forecast, by Cancer Type (2020-2032)
11.5.4.3. Market Revenue and Forecast, by End-user (2020-2032)
11.5.5. Rest of LATAM
11.5.5.1. Market Revenue and Forecast, by Component (2020-2032)
11.5.5.2. Market Revenue and Forecast, by Cancer Type (2020-2032)
11.5.5.3. Market Revenue and Forecast, by End-user (2020-2032)
Chapter 12. Company Profiles
12.1. EarlySign
12.1.1. Company Overview
12.1.2. Product Offerings
12.1.3. Financial Performance
12.1.4. Recent Initiatives
12.2. Cancer Center.ai
12.2.1. Company Overview
12.2.2. Product Offerings
12.2.3. Financial Performance
12.2.4. Recent Initiatives
12.3. Microsoft
12.3.1. Company Overview
12.3.2. Product Offerings
12.3.3. Financial Performance
12.3.4. Recent Initiatives
12.4. Flatiron
12.4.1. Company Overview
12.4.2. Product Offerings
12.4.3. Financial Performance
12.4.4. Recent Initiatives
12.5. Path AI
12.5.1. Company Overview
12.5.2. Product Offerings
12.5.3. Financial Performance
12.5.4. Recent Initiatives
12.6. Therapixel
12.6.1. Company Overview
12.6.2. Product Offerings
12.6.3. Financial Performance
12.6.4. Recent Initiatives
12.7. Tempus
12.7.1. Company Overview
12.7.2. Product Offerings
12.7.3. Financial Performance
12.7.4. Recent Initiatives
12.8. Paige AI, Inc.
12.8.1. Company Overview
12.8.2. Product Offerings
12.8.3. Financial Performance
12.8.4. Recent Initiatives
12.9. Kheiron Medical Technologies Limited
12.9.1. Company Overview
12.9.2. Product Offerings
12.9.3. Financial Performance
12.9.4. Recent Initiatives
12.10. SkinVision
12.10.1. Company Overview
12.10.2. Product Offerings
12.10.3. Financial Performance
12.10.4. Recent Initiatives
Chapter 13. Research Methodology
13.1. Primary Research
13.2. Secondary Research
13.3. Assumptions
Chapter 14. Appendix
14.1. About Us
14.2. Glossary of Terms
 Cross-segment Market Size and Analysis for
Mentioned Segments
Additional Company Profiles (Upto 5 With No Cost)
Additional Countries (Apart From Mentioned Countries)
Country/Region-specific Report
Go To Market Strategy
Region Specific Market DynamicsRegion Level Market Share Import Export AnalysisProduction AnalysisOthers
Cross-segment Market Size and Analysis for
Mentioned Segments
Additional Company Profiles (Upto 5 With No Cost)
Additional Countries (Apart From Mentioned Countries)
Country/Region-specific Report
Go To Market Strategy
Region Specific Market DynamicsRegion Level Market Share Import Export AnalysisProduction AnalysisOthers