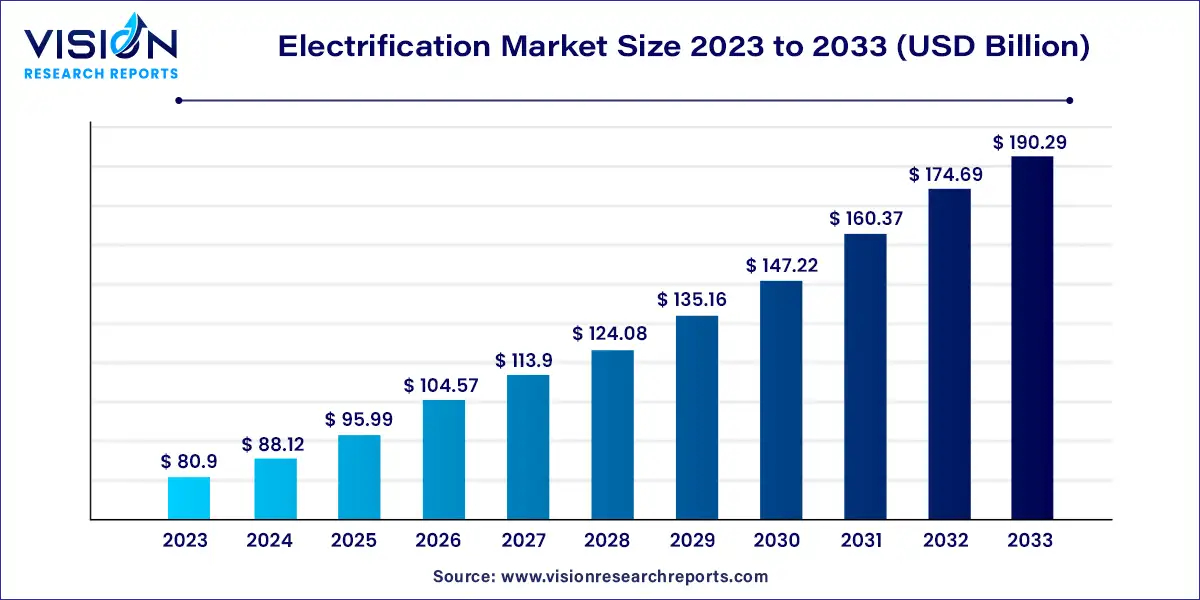
The global electrification market size was estimated at around USD 80.9 billion in 2023 and it is projected to hit around USD 190.29 billion by 2033, growing at a CAGR of 8.93% from 2024 to 2033. The electrification market is a dynamic and rapidly evolving sector, driven by the global transition toward sustainable energy solutions and the modernization of infrastructure.

The electrification market is experiencing robust growth driven by the global push for sustainability and reduced carbon emissions is a primary catalyst. Governments and organizations are implementing policies that favor cleaner energy sources, propelling the demand for electrification across various sectors. Technological advancements also play a crucial role, as innovations in electric vehicles, energy storage, and smart grids enhance the feasibility and efficiency of electrification. Additionally, the decreasing costs of renewable energy technologies and the expanding availability of financial incentives make electrification more accessible and economically viable. Finally, increased awareness of environmental issues and consumer preference for greener solutions further accelerate market growth, as both residential and commercial entities seek to adopt sustainable practices.
In 2023, the renewable energy sector emerged as the leading segment in the electrification market, capturing the largest revenue share. This dominance is primarily driven by heightened concerns about climate change and the urgent need to lower greenhouse gas emissions. Environmental regulations in both developed and developing nations are expected to further boost growth in this segment. Technological advancements in solar photovoltaic (PV) systems and energy storage solutions are anticipated to provide substantial growth opportunities for renewable energy.
Conversely, the fossil fuels segment is projected to experience notable growth at a significant compound annual growth rate (CAGR) during the forecast period. Rising global populations and the consequent increase in energy demand, particularly in emerging economies, contribute to this trend. Despite the push towards cleaner energy, fossil fuels continue to supply approximately 80% of global energy needs. Additionally, the growing middle-class population in these regions is driving higher energy consumption, supporting the expansion of the fossil fuels segment.
In 2023, the transportation sector was the largest contributor to the global electrification market. Increasing awareness about air pollution and climate change has intensified the need to reduce carbon emissions in transportation. Electrification, notably through electric vehicles (EVs), is a key solution to this challenge. Furthermore, many countries are implementing policies and incentives to encourage EV adoption, including tax credits and emission requirements for automakers. These measures are expected to drive continued growth in the transportation segment.
The building sector is identified as the fastest-growing segment during the forecast period. This growth is largely due to advancements in construction technologies and the rising popularity of heat pumps as a preferred heating solution in newly built residential properties.
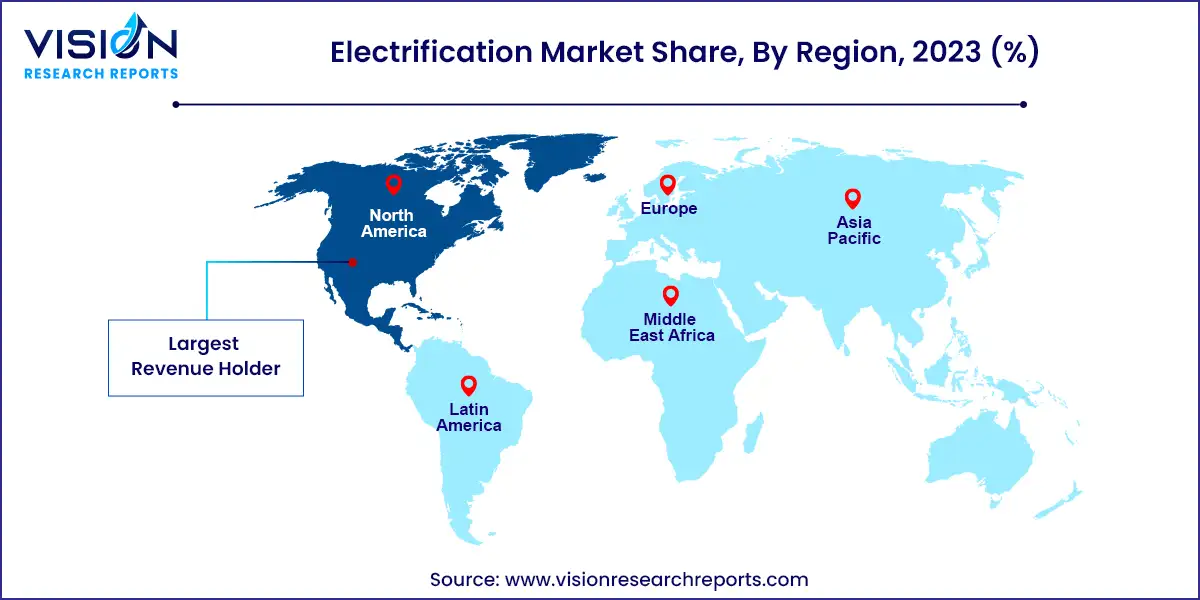
In 2023, North America held the largest revenue share in the electrification market, driven by early technology adoption and supportive policies. For example, Canada’s Ministry of Natural Resources announced funding for EV charger installations through the Zero-Emission Vehicle Infrastructure Program (ZEVIP), aimed at enhancing EV charging access. This initiative, alongside other regional policies, underscores North America's leading position in the market.

Asia-Pacific is expected to register the highest CAGR during the forecast period, driven by rapid urbanization in the region. As more individuals migrate to urban areas, the demand for electrification solutions in transportation, buildings, and other sectors is anticipated to grow significantly.
By Source
By Application
By Region
Chapter 1. Introduction
1.1. Research Objective
1.2. Scope of the Study
1.3. Definition
Chapter 2. Research Methodology
2.1. Research Approach
2.2. Data Sources
2.3. Assumptions & Limitations
Chapter 3. Executive Summary
3.1. Market Snapshot
Chapter 4. Market Variables and Scope
4.1. Introduction
4.2. Market Classification and Scope
4.3. Industry Value Chain Analysis
4.3.1. Raw Material Procurement Analysis
4.3.2. Sales and Distribution Channel Analysis
4.3.3. Downstream Buyer Analysis
Chapter 5. COVID 19 Impact on Electrification Market
5.1. COVID-19 Landscape: Electrification Industry Impact
5.2. COVID 19 - Impact Assessment for the Industry
5.3. COVID 19 Impact: Global Major Government Policy
5.4. Market Trends and Opportunities in the COVID-19 Landscape
Chapter 6. Market Dynamics Analysis and Trends
6.1. Market Dynamics
6.1.1. Market Drivers
6.1.2. Market Restraints
6.1.3. Market Opportunities
6.2. Porter’s Five Forces Analysis
6.2.1. Bargaining power of suppliers
6.2.2. Bargaining power of buyers
6.2.3. Threat of substitute
6.2.4. Threat of new entrants
6.2.5. Degree of competition
Chapter 7. Competitive Landscape
7.1.1. Company Market Share/Positioning Analysis
7.1.2. Key Strategies Adopted by Players
7.1.3. Vendor Landscape
7.1.3.1. List of Suppliers
7.1.3.2. List of Buyers
Chapter 8. Global Electrification Market, By Source
8.1. Electrification Market, by Source, 2024-2033
8.1.1. Renewable Energy
8.1.1.1. Market Revenue and Forecast (2021-2033)
8.1.2. Nuclear Power
8.1.2.1. Market Revenue and Forecast (2021-2033)
8.1.3. Fossil Fuel-based
8.1.3.1. Market Revenue and Forecast (2021-2033)
Chapter 9. Global Electrification Market, By Application
9.1. Electrification Market, by Application, 2024-2033
9.1.1. Transportation
9.1.1.1. Market Revenue and Forecast (2021-2033)
9.1.2. Industrial
9.1.2.1. Market Revenue and Forecast (2021-2033)
9.1.3. Buildings
9.1.3.1. Market Revenue and Forecast (2021-2033)
Chapter 10. Global Electrification Market, Regional Estimates and Trend Forecast
10.1. North America
10.1.1. Market Revenue and Forecast, by Source (2021-2033)
10.1.2. Market Revenue and Forecast, by Application (2021-2033)
10.1.3. U.S.
10.1.3.1. Market Revenue and Forecast, by Source (2021-2033)
10.1.3.2. Market Revenue and Forecast, by Application (2021-2033)
10.1.4. Rest of North America
10.1.4.1. Market Revenue and Forecast, by Source (2021-2033)
10.1.4.2. Market Revenue and Forecast, by Application (2021-2033)
10.2. Europe
10.2.1. Market Revenue and Forecast, by Source (2021-2033)
10.2.2. Market Revenue and Forecast, by Application (2021-2033)
10.2.3. UK
10.2.3.1. Market Revenue and Forecast, by Source (2021-2033)
10.2.3.2. Market Revenue and Forecast, by Application (2021-2033)
10.2.4. Germany
10.2.4.1. Market Revenue and Forecast, by Source (2021-2033)
10.2.4.2. Market Revenue and Forecast, by Application (2021-2033)
10.2.5. France
10.2.5.1. Market Revenue and Forecast, by Source (2021-2033)
10.2.5.2. Market Revenue and Forecast, by Application (2021-2033)
10.2.6. Rest of Europe
10.2.6.1. Market Revenue and Forecast, by Source (2021-2033)
10.2.6.2. Market Revenue and Forecast, by Application (2021-2033)
10.3. APAC
10.3.1. Market Revenue and Forecast, by Source (2021-2033)
10.3.2. Market Revenue and Forecast, by Application (2021-2033)
10.3.3. India
10.3.3.1. Market Revenue and Forecast, by Source (2021-2033)
10.3.3.2. Market Revenue and Forecast, by Application (2021-2033)
10.3.4. China
10.3.4.1. Market Revenue and Forecast, by Source (2021-2033)
10.3.4.2. Market Revenue and Forecast, by Application (2021-2033)
10.3.5. Japan
10.3.5.1. Market Revenue and Forecast, by Source (2021-2033)
10.3.5.2. Market Revenue and Forecast, by Application (2021-2033)
10.3.6. Rest of APAC
10.3.6.1. Market Revenue and Forecast, by Source (2021-2033)
10.3.6.2. Market Revenue and Forecast, by Application (2021-2033)
10.4. MEA
10.4.1. Market Revenue and Forecast, by Source (2021-2033)
10.4.2. Market Revenue and Forecast, by Application (2021-2033)
10.4.3. GCC
10.4.3.1. Market Revenue and Forecast, by Source (2021-2033)
10.4.3.2. Market Revenue and Forecast, by Application (2021-2033)
10.4.4. North Africa
10.4.4.1. Market Revenue and Forecast, by Source (2021-2033)
10.4.4.2. Market Revenue and Forecast, by Application (2021-2033)
10.4.5. South Africa
10.4.5.1. Market Revenue and Forecast, by Source (2021-2033)
10.4.5.2. Market Revenue and Forecast, by Application (2021-2033)
10.4.6. Rest of MEA
10.4.6.1. Market Revenue and Forecast, by Source (2021-2033)
10.4.6.2. Market Revenue and Forecast, by Application (2021-2033)
10.5. Latin America
10.5.1. Market Revenue and Forecast, by Source (2021-2033)
10.5.2. Market Revenue and Forecast, by Application (2021-2033)
10.5.3. Brazil
10.5.3.1. Market Revenue and Forecast, by Source (2021-2033)
10.5.3.2. Market Revenue and Forecast, by Application (2021-2033)
10.5.4. Rest of LATAM
10.5.4.1. Market Revenue and Forecast, by Source (2021-2033)
10.5.4.2. Market Revenue and Forecast, by Application (2021-2033)
Chapter 11. Company Profiles
11.1. ABB
11.1.1. Company Overview
11.1.2. Product Offerings
11.1.3. Financial Performance
11.1.4. Recent Initiatives
11.2. ZAPI GROUP
11.2.1. Company Overview
11.2.2. Product Offerings
11.2.3. Financial Performance
11.2.4. Recent Initiatives
11.3. Powersys Solutions
11.3.1. Company Overview
11.3.2. Product Offerings
11.3.3. Financial Performance
11.3.4. Recent Initiatives
11.4. Siemens
11.4.1. Company Overview
11.4.2. Product Offerings
11.4.3. Financial Performance
11.4.4. LTE Scientific
11.5. Enel Spa
11.5.1. Company Overview
11.5.2. Product Offerings
11.5.3. Financial Performance
11.5.4. Recent Initiatives
11.6. Schneider Electric
11.6.1. Company Overview
11.6.2. Product Offerings
11.6.3. Financial Performance
11.6.4. Recent Initiatives
11.7. Duke Energy Corporation
11.7.1. Company Overview
11.7.2. Product Offerings
11.7.3. Financial Performance
11.7.4. Recent Initiatives
11.8. General Electric
11.8.1. Company Overview
11.8.2. Product Offerings
11.8.3. Financial Performance
11.8.4. Recent Initiatives
11.9. Enel X S.r.l.
11.9.1. Company Overview
11.9.2. Product Offerings
11.9.3. Financial Performance
11.9.4. Recent Initiatives
11.10. ICF International Inc.
11.10.1. Company Overview
11.10.2. Product Offerings
11.10.3. Financial Performance
11.10.4. Recent Initiatives
Chapter 12. Research Methodology
12.1. Primary Research
12.2. Secondary Research
12.3. Assumptions
Chapter 13. Appendix
13.1. About Us
13.2. Glossary of Terms
 Cross-segment Market Size and Analysis for
Mentioned Segments
 Additional Company Profiles (Upto 5 With No Cost)
 Additional Countries (Apart From Mentioned Countries)
 Country/Region-specific Report
 Go To Market Strategy
 Region Specific Market Dynamics
 Region Level Market Share
 Import Export Analysis
 Production Analysis
 Others