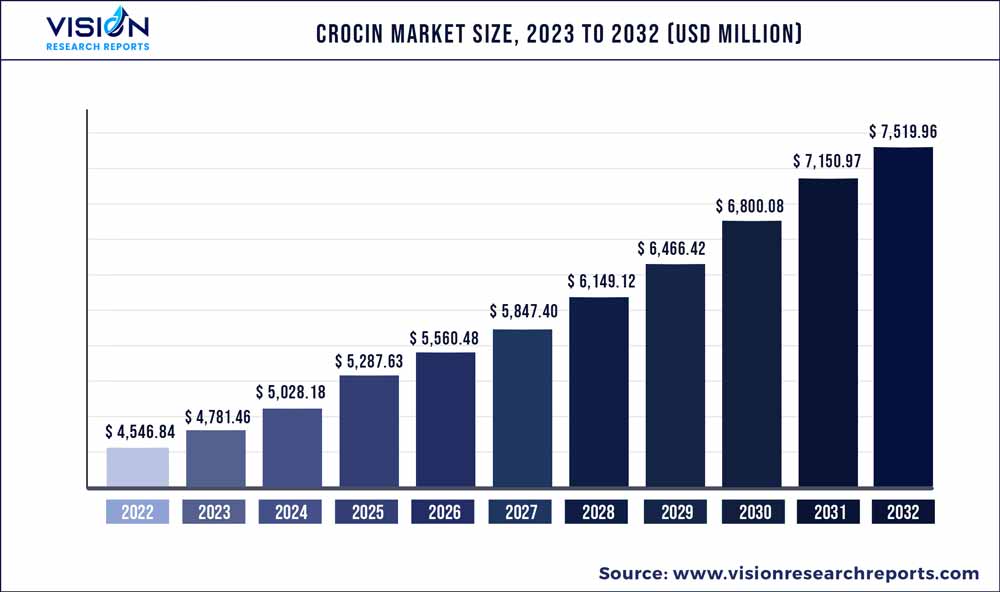
The global crocin market size was estimated at around USD 4,546.84 million in 2022 and it is projected to hit around USD 7,519.96 million by 2032, growing at a CAGR of 5.16% from 2023 to 2032.
Key Pointers
Report Scope of the Crocin Market
| Report Coverage | Details |
| Market Size in 2022 | USD 4,546.84 million |
| Revenue Forecast by 2032 | USD 7,519.96 million |
| Growth rate from 2023 to 2032 | CAGR of 5.16% |
| Base Year | 2022 |
| Forecast Period | 2023 to 2032 |
| Market Analysis (Terms Used) | Value (US$ Million/Billion) or (Volume/Units) |
| Regions Covered | North America, Europe, Asia Pacific, Latin America, Middle East & Africa |
| Companies Covered | TCI Chemicals Pvt. Ltd.; Merck KGaA; GSK plc.; Cayman Chemical; APExBIO Technology; Wilshire Technologies; Biosynth, Cipla, Inc.; Novartis AG; Sanofi; Aurobindo Pharma; Teva Pharmaceutical Industries Ltd.; Mallinckrodt |
The crocin market growth is attributed to the global rise in the prevalence of chronic diseases such as cardiovascular disorders & cancer and the rapidly aging population. According to the Commentary on Chronic Disease Prevention in 2022 published by the National Association of Chronic Disease Directors, nearly 60% of adult Americans have at least one chronic disease.
Oral diseases affect approximately 3.55 bn people, causing discomfort and pain, according to WHO. Paracetamol is commonly used to treat minor to moderate pain, such as headaches, toothaches, backaches, fever, neurological discomfort, and osteoarthritis. As pain levels rise, so does the need for relievers.
The rising incidence of pain is expected to boost the market growth of NSAIDs during the forecast period. According to the CDC in 2019, around 20.4% of the adult population suffered from chronic pain in the U.S. For instance, 1 in 6 people will be over the age of 60 years in the world and by 2050 the population of people aged 60 years and above would double i.e., 2.1 billion, as per the statistics published by WHO.
Paracetamol is the most commonly used analgesic in older people as a means of pain management or mostly to treat lower back or musculoskeletal-related conditions. The rising prevalence of flu and the increased use of OTC products are propelling growth. Migraine is one of the most common diseases, causing headaches and other complications where the usage of Crocin or paracetamol is very high.
Furthermore, key players are engaged in mergers, acquisitions & partnerships, and product launches to strengthen their product portfolios & manufacturing capacities and provide competitive differentiation. For instance, in August 2022, Haleon Group of Companies introduced New Advil PLUS Acetaminophen, a single tablet containing ibuprofen and acetaminophen, in Canada.
Application Insights
The drug segment is anticipated to dominate the crocin industry with a revenue share of 71.81% in 2022 owing to the increasing production of paracetamol to be used for relieving pain and fever. People suffering from high fevers and flu-related aches & pains commonly used paracetamol. Moreover, the market growth can be attributed to a variety of factors.
Some of the major ones are the increasing prevalence of conditions like headaches & flu and the increasing demand for pain management drugs. Paracetamol is commonly used to treat minor to moderate pains such as headaches, toothaches, osteoarthritis, menstrual periods, backaches, and flu or cold symptoms. It is also used to reduce fever as an effective antipyretic. The increasing burden of indicative conditions and over-the-counter (OTC) use of the products is propelling the market.
The chemical industry segment is expected to grow at the fastest rate during the forecast period. The chemical works in the crocin market by supporting the production of key raw materials and chemicals for acetaminophen, i.e. paracetamol. Commercially, phenol, ortho-, and para-nitrotoluene are majorly made available to the pharmaceutical industry by the chemical industry, which drives the growth of the chemical industry as a major supplier.
Purity Insights
The purity >98% segment held the largest share of 95.43% of the market in 2022 and is also expected to show the fastest growth in the forecast period owing to the high purity associated with the formulation made from this formulation. The dominance of this segment can be attributed to the increasing number of surgeries carried out in Purity >98% owing to the presence of qualified and specialized healthcare professionals. The need for rapid relief from postoperative pain is further driving the market growth. Purity >98% are equipped with surgical equipment that makes accepting patients easier. Moreover, the rising concerns to treat acute and mild postoperative pain are leading the overall market growth.
The purity <98% segment held the second-largest revenue share of the crocin market and is expected to maintain its dominance over the forecast period. The use of purity >98% is higher than that of the <98% purity, this can be attributed to the overall growth.
Indication Insights
The pain indication segment dominated the market with a revenue share of 58.42% in 2022 owing to increasing acceptability and tolerability associated with paracetamol for relieving pain. Paracetamol is administered through oral or Intravenous (IV) route. However, the IV route of administration is widely adopted for relieving pain owing to its effectiveness and rapid action. A single dose of crocin given intravenously is effective in relieving pain for around 4 hours for about 37% of patients with acute postoperative pain.
Pyrexia segment is expected to grow at the fastest rate in the forecast period as paracetamol is one of the most commonly used legal drugs for treating pyrexia and lowering fever. The medication is widely available on prescription & over the counter and is extensively used due to the low side effects. During the COVID-19 pandemic, paracetamol was commonly used and consumed by the population for relieving fever, which was associated with the infection. Several brands of paracetamol are available in the market, enhancing the buyers' acceptability. Fever is associated with many diseases and disorders, which increases the need for regulation of body temperature so that treatment for the underlying condition can be managed more precisely.
Distribution Channel Insights
Hospital pharmacies led the distribution channel segment in 2022 with a share of 47.24% as they are the key stakeholders in the market handling medications in a crucial hospital environment that requires immediate access to medicine & products. Moreover, these pharmacies cover outpatient and inpatient services, facilitating easy treatment of gastrointestinal diseases in patients. The dominance of this segment can be attributed to the increasing number of surgeries carried out in hospitals owing to the presence of qualified and specialized healthcare professionals.
The retail pharmacies segment is expected to show the fastest growth over the forecast period. The retail pharmacy segment is moving toward consolidation, and pharmacies are forming groups & pharmacy chains. This horizontal integration is projected to lead to market consolidation and create a dominance of prominent players. The pharmacists’ experience & physical presence and proximity in these pharmacies provide the segment a competitive edge over online pharmacies.
Regional Insights
North America emerged as one of the prominent regional markets in 2022 with a revenue share of 39.53%. The growth in the region can be attributed to the increasing need for pain management drugs among the population in the region. The market growth can be attributed to the increasing prevalence of headaches and migraine in the region. According to an article published in January 2021 by the American Migraine Foundation, more than 4 million adults in the U.S. suffer from chronic daily migraine, with a minimum of 15 headache days per month. The increasing disposable income and expanding patient pool in the region are expected to drive market growth.
Asia Pacific is expected to expand at a CAGR of 5.59% from 2023 to 2032. The growth in the region can be attributed to the presence of China and India in the region with these countries being the world’s two largest API producers responsible for supplying around 80% of the global paracetamol, making Asia the largest source of paracetamol. Moreover, its massive population makes it the world’s largest consumer market.
Crocin Market Segmentations:
By Application
By Purity
By Indication
By Distribution Channel
By Regional
Chapter 1. Introduction
1.1. Research Objective
1.2. Scope of the Study
1.3. Definition
Chapter 2. Research Methodology
2.1. Research Approach
2.2. Data Sources
2.3. Assumptions & Limitations
Chapter 3. Executive Summary
3.1. Market Snapshot
Chapter 4. Market Variables and Scope
4.1. Introduction
4.2. Market Classification and Scope
4.3. Industry Value Chain Analysis
4.3.1. Raw Material Procurement Analysis
4.3.2. Sales and Distribution Channel Analysis
4.3.3. Downstream Buyer Analysis
Chapter 5. COVID 19 Impact on Crocin Market
5.1. COVID-19 Landscape: Crocin Industry Impact
5.2. COVID 19 - Impact Assessment for the Industry
5.3. COVID 19 Impact: Global Major Government Policy
5.4. Market Trends and Opportunities in the COVID-19 Landscape
Chapter 6. Market Dynamics Analysis and Trends
6.1. Market Dynamics
6.1.1. Market Drivers
6.1.2. Market Restraints
6.1.3. Market Opportunities
6.2. Porter’s Five Forces Analysis
6.2.1. Bargaining power of suppliers
6.2.2. Bargaining power of buyers
6.2.3. Threat of substitute
6.2.4. Threat of new entrants
6.2.5. Degree of competition
Chapter 7. Competitive Landscape
7.1.1. Company Market Share/Positioning Analysis
7.1.2. Key Strategies Adopted by Players
7.1.3. Vendor Landscape
7.1.3.1. List of Suppliers
7.1.3.2. List of Buyers
Chapter 8. Global Crocin Market, By Application
8.1. Crocin Market, by Application, 2023-2032
8.1.1. Food
8.1.1.1. Market Revenue and Forecast (2020-2032)
8.1.2. Chemical Industry
8.1.2.1. Market Revenue and Forecast (2020-2032)
8.1.3. Drug
8.1.3.1. Market Revenue and Forecast (2020-2032)
8.1.4. Others
8.1.4.1. Market Revenue and Forecast (2020-2032)
Chapter 9. Global Crocin Market, By Purity
9.1. Crocin Market, by Purity, 2023-2032
9.1.1. Purity >98%
9.1.1.1. Market Revenue and Forecast (2020-2032)
9.1.2. Purity <98%
9.1.2.1. Market Revenue and Forecast (2020-2032)
Chapter 10. Global Crocin Market, By Indication
10.1. Crocin Market, by Indication, 2023-2032
10.1.1. Pain
10.1.1.1. Market Revenue and Forecast (2020-2032)
10.1.2. Pyrexia (Fever)
10.1.2.1. Market Revenue and Forecast (2020-2032)
Chapter 11. Global Crocin Market, By Distribution Channel
11.1. Crocin Market, by Distribution Channel, 2023-2032
11.1.1. Hospital Pharmacy
11.1.1.1. Market Revenue and Forecast (2020-2032)
11.1.2. Retail Pharmacy
11.1.2.1. Market Revenue and Forecast (2020-2032)
11.1.3. Others
11.1.3.1. Market Revenue and Forecast (2020-2032)
Chapter 12. Global Crocin Market, Regional Estimates and Trend Forecast
12.1. North America
12.1.1. Market Revenue and Forecast, by Application (2020-2032)
12.1.2. Market Revenue and Forecast, by Purity (2020-2032)
12.1.3. Market Revenue and Forecast, by Indication (2020-2032)
12.1.4. Market Revenue and Forecast, by Distribution Channel (2020-2032)
12.1.5. U.S.
12.1.5.1. Market Revenue and Forecast, by Application (2020-2032)
12.1.5.2. Market Revenue and Forecast, by Purity (2020-2032)
12.1.5.3. Market Revenue and Forecast, by Indication (2020-2032)
12.1.5.4. Market Revenue and Forecast, by Distribution Channel (2020-2032)
12.1.6. Rest of North America
12.1.6.1. Market Revenue and Forecast, by Application (2020-2032)
12.1.6.2. Market Revenue and Forecast, by Purity (2020-2032)
12.1.6.3. Market Revenue and Forecast, by Indication (2020-2032)
12.1.6.4. Market Revenue and Forecast, by Distribution Channel (2020-2032)
12.2. Europe
12.2.1. Market Revenue and Forecast, by Application (2020-2032)
12.2.2. Market Revenue and Forecast, by Purity (2020-2032)
12.2.3. Market Revenue and Forecast, by Indication (2020-2032)
12.2.4. Market Revenue and Forecast, by Distribution Channel (2020-2032)
12.2.5. UK
12.2.5.1. Market Revenue and Forecast, by Application (2020-2032)
12.2.5.2. Market Revenue and Forecast, by Purity (2020-2032)
12.2.5.3. Market Revenue and Forecast, by Indication (2020-2032)
12.2.5.4. Market Revenue and Forecast, by Distribution Channel (2020-2032)
12.2.6. Germany
12.2.6.1. Market Revenue and Forecast, by Application (2020-2032)
12.2.6.2. Market Revenue and Forecast, by Purity (2020-2032)
12.2.6.3. Market Revenue and Forecast, by Indication (2020-2032)
12.2.6.4. Market Revenue and Forecast, by Distribution Channel (2020-2032)
12.2.7. France
12.2.7.1. Market Revenue and Forecast, by Application (2020-2032)
12.2.7.2. Market Revenue and Forecast, by Purity (2020-2032)
12.2.7.3. Market Revenue and Forecast, by Indication (2020-2032)
12.2.7.4. Market Revenue and Forecast, by Distribution Channel (2020-2032)
12.2.8. Rest of Europe
12.2.8.1. Market Revenue and Forecast, by Application (2020-2032)
12.2.8.2. Market Revenue and Forecast, by Purity (2020-2032)
12.2.8.3. Market Revenue and Forecast, by Indication (2020-2032)
12.2.8.4. Market Revenue and Forecast, by Distribution Channel (2020-2032)
12.3. APAC
12.3.1. Market Revenue and Forecast, by Application (2020-2032)
12.3.2. Market Revenue and Forecast, by Purity (2020-2032)
12.3.3. Market Revenue and Forecast, by Indication (2020-2032)
12.3.4. Market Revenue and Forecast, by Distribution Channel (2020-2032)
12.3.5. India
12.3.5.1. Market Revenue and Forecast, by Application (2020-2032)
12.3.5.2. Market Revenue and Forecast, by Purity (2020-2032)
12.3.5.3. Market Revenue and Forecast, by Indication (2020-2032)
12.3.5.4. Market Revenue and Forecast, by Distribution Channel (2020-2032)
12.3.6. China
12.3.6.1. Market Revenue and Forecast, by Application (2020-2032)
12.3.6.2. Market Revenue and Forecast, by Purity (2020-2032)
12.3.6.3. Market Revenue and Forecast, by Indication (2020-2032)
12.3.6.4. Market Revenue and Forecast, by Distribution Channel (2020-2032)
12.3.7. Japan
12.3.7.1. Market Revenue and Forecast, by Application (2020-2032)
12.3.7.2. Market Revenue and Forecast, by Purity (2020-2032)
12.3.7.3. Market Revenue and Forecast, by Indication (2020-2032)
12.3.7.4. Market Revenue and Forecast, by Distribution Channel (2020-2032)
12.3.8. Rest of APAC
12.3.8.1. Market Revenue and Forecast, by Application (2020-2032)
12.3.8.2. Market Revenue and Forecast, by Purity (2020-2032)
12.3.8.3. Market Revenue and Forecast, by Indication (2020-2032)
12.3.8.4. Market Revenue and Forecast, by Distribution Channel (2020-2032)
12.4. MEA
12.4.1. Market Revenue and Forecast, by Application (2020-2032)
12.4.2. Market Revenue and Forecast, by Purity (2020-2032)
12.4.3. Market Revenue and Forecast, by Indication (2020-2032)
12.4.4. Market Revenue and Forecast, by Distribution Channel (2020-2032)
12.4.5. GCC
12.4.5.1. Market Revenue and Forecast, by Application (2020-2032)
12.4.5.2. Market Revenue and Forecast, by Purity (2020-2032)
12.4.5.3. Market Revenue and Forecast, by Indication (2020-2032)
12.4.5.4. Market Revenue and Forecast, by Distribution Channel (2020-2032)
12.4.6. North Africa
12.4.6.1. Market Revenue and Forecast, by Application (2020-2032)
12.4.6.2. Market Revenue and Forecast, by Purity (2020-2032)
12.4.6.3. Market Revenue and Forecast, by Indication (2020-2032)
12.4.6.4. Market Revenue and Forecast, by Distribution Channel (2020-2032)
12.4.7. South Africa
12.4.7.1. Market Revenue and Forecast, by Application (2020-2032)
12.4.7.2. Market Revenue and Forecast, by Purity (2020-2032)
12.4.7.3. Market Revenue and Forecast, by Indication (2020-2032)
12.4.7.4. Market Revenue and Forecast, by Distribution Channel (2020-2032)
12.4.8. Rest of MEA
12.4.8.1. Market Revenue and Forecast, by Application (2020-2032)
12.4.8.2. Market Revenue and Forecast, by Purity (2020-2032)
12.4.8.3. Market Revenue and Forecast, by Indication (2020-2032)
12.4.8.4. Market Revenue and Forecast, by Distribution Channel (2020-2032)
12.5. Latin America
12.5.1. Market Revenue and Forecast, by Application (2020-2032)
12.5.2. Market Revenue and Forecast, by Purity (2020-2032)
12.5.3. Market Revenue and Forecast, by Indication (2020-2032)
12.5.4. Market Revenue and Forecast, by Distribution Channel (2020-2032)
12.5.5. Brazil
12.5.5.1. Market Revenue and Forecast, by Application (2020-2032)
12.5.5.2. Market Revenue and Forecast, by Purity (2020-2032)
12.5.5.3. Market Revenue and Forecast, by Indication (2020-2032)
12.5.5.4. Market Revenue and Forecast, by Distribution Channel (2020-2032)
12.5.6. Rest of LATAM
12.5.6.1. Market Revenue and Forecast, by Application (2020-2032)
12.5.6.2. Market Revenue and Forecast, by Purity (2020-2032)
12.5.6.3. Market Revenue and Forecast, by Indication (2020-2032)
12.5.6.4. Market Revenue and Forecast, by Distribution Channel (2020-2032)
Chapter 13. Company Profiles
13.1. TCI Chemicals Pvt. Ltd.
13.1.1. Company Overview
13.1.2. Product Offerings
13.1.3. Financial Performance
13.1.4. Recent Initiatives
13.2. Merck KGaA
13.2.1. Company Overview
13.2.2. Product Offerings
13.2.3. Financial Performance
13.2.4. Recent Initiatives
13.3. GSK plc.
13.3.1. Company Overview
13.3.2. Product Offerings
13.3.3. Financial Performance
13.3.4. Recent Initiatives
13.4. Cayman Chemical
13.4.1. Company Overview
13.4.2. Product Offerings
13.4.3. Financial Performance
13.4.4. Recent Initiatives
13.5. APExBIO Technology
13.5.1. Company Overview
13.5.2. Product Offerings
13.5.3. Financial Performance
13.5.4. Recent Initiatives
13.6. Wilshire Technologies
13.6.1. Company Overview
13.6.2. Product Offerings
13.6.3. Financial Performance
13.6.4. Recent Initiatives
13.7. Biosynth
13.7.1. Company Overview
13.7.2. Product Offerings
13.7.3. Financial Performance
13.7.4. Recent Initiatives
13.8. Cipla, Inc.
13.8.1. Company Overview
13.8.2. Product Offerings
13.8.3. Financial Performance
13.8.4. Recent Initiatives
13.9. Novartis AG
13.9.1. Company Overview
13.9.2. Product Offerings
13.9.3. Financial Performance
13.9.4. Recent Initiatives
13.10. Sanofi
13.10.1. Company Overview
13.10.2. Product Offerings
13.10.3. Financial Performance
13.10.4. Recent Initiatives
Chapter 14. Research Methodology
14.1. Primary Research
14.2. Secondary Research
14.3. Assumptions
Chapter 15. Appendix
15.1. About Us
15.2. Glossary of Terms
 Cross-segment Market Size and Analysis for
Mentioned Segments
Additional Company Profiles (Upto 5 With No Cost)
Additional Countries (Apart From Mentioned Countries)
Country/Region-specific Report
Go To Market Strategy
Region Specific Market DynamicsRegion Level Market Share Import Export AnalysisProduction AnalysisOthers
Cross-segment Market Size and Analysis for
Mentioned Segments
Additional Company Profiles (Upto 5 With No Cost)
Additional Countries (Apart From Mentioned Countries)
Country/Region-specific Report
Go To Market Strategy
Region Specific Market DynamicsRegion Level Market Share Import Export AnalysisProduction AnalysisOthers