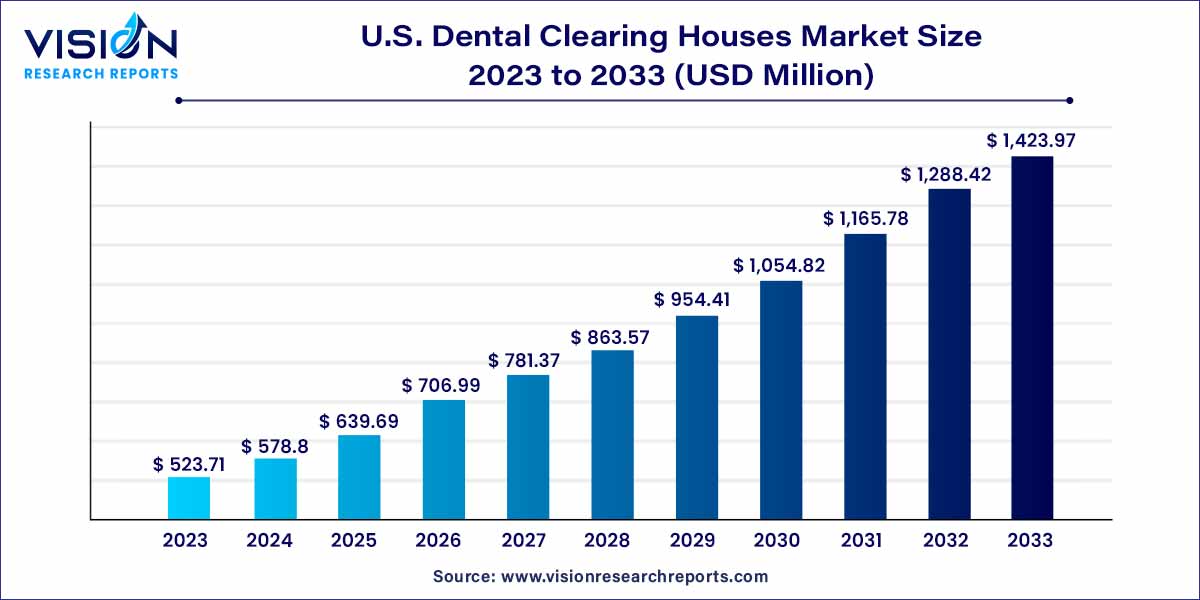
The U.S. dental clearing houses market size was estimated at around USD 523.71 million in 2023 and it is projected to hit around USD 1,423.97 million by 2033, growing at a CAGR of 10.52% from 2024 to 2033. The U.S. dental clearing houses market is driven by a rising demand for streamlined and efficient dental insurance processes, operational efficiency for dental practices, and adaptation to regulatory changes.

In recent years, the U.S. dental industry has witnessed a significant transformation, with the integration of technology playing a pivotal role. One key aspect of this evolution is the emergence and growth of dental clearing houses. This article aims to provide an insightful overview of the U.S. Dental Clearing Houses Market, shedding light on its dynamics, key players, and the impact on the broader dental landscape.
The growth of the U.S. dental clearing houses market can be attributed to several key factors propelling its expansion. Firstly, the increasing complexity of dental insurance processes has led to a heightened demand for streamlined solutions, positioning dental clearing houses as indispensable intermediaries. The integration of advanced technologies within these clearing houses, such as sophisticated software solutions, has significantly enhanced the speed, accuracy, and security of claims processing. As dental practices strive for operational efficiency, the role of clearing houses in facilitating seamless communication and data exchange between practices and insurance providers has become pivotal. Moreover, the regulatory landscape governing the U.S. dental industry underscores the importance of compliance, prompting dental practices to rely on clearing houses to navigate evolving regulations successfully. These factors collectively contribute to the upward trajectory of the U.S. Dental Clearing Houses Market, making them essential contributors to the efficiency and effectiveness of financial workflows within the dental ecosystem.
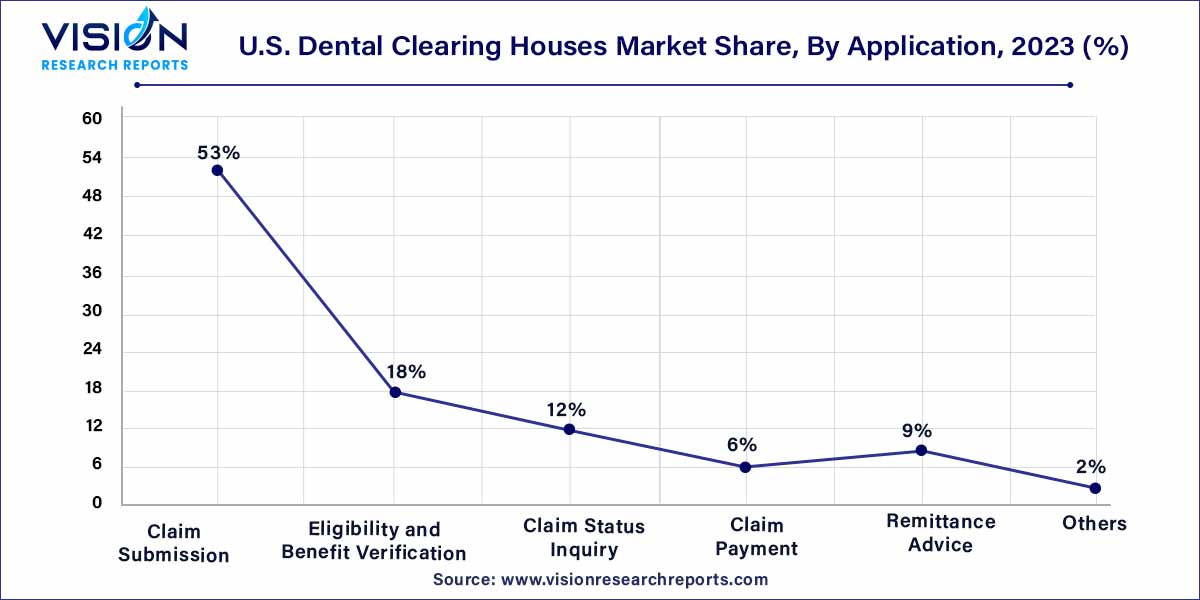
The claim submission segment held the largest revenue share of 53% in 2023. This dominance is linked to the upsurge in electronic submission volumes and increased expenditure on claim submissions, primarily driven by a rise in patient encounters. As indicated by the 2022 CAQH Index, approximately 662 million dental claims were electronically submitted.

The eligibility and benefit verification segment is predicted to grow at the remarkable CAGR over the forecast period. This growth is influenced by the escalating rates of claim denials attributed to patient eligibility issues. As highlighted in the Optum 2022 Revenue Cycle Denials Index, registration and eligibility emerged as the primary reasons for medical claims denial in the U.S. in 2022, constituting about 22% of the total denied claims. Dental clearing houses play a crucial role by providing electronic eligibility and benefit verification services to mitigate claim rejection, enhance cash flows, and streamline operations, contributing significantly to the segment's substantial market share.
By Application
Chapter 1. Introduction
1.1. Research Objective
1.2. Scope of the Study
1.3. Definition
Chapter 2. Research Methodology
2.1. Research Approach
2.2. Data Sources
2.3. Assumptions & Limitations
Chapter 3. Executive Summary
3.1. Market Snapshot
Chapter 4. Market Variables and Scope
4.1. Introduction
4.2. Market Classification and Scope
4.3. Industry Value Chain Analysis
4.3.1. Raw Material Procurement Analysis
4.3.2. Sales and Distribution Channel Analysis
4.3.3. Downstream Buyer Analysis
Chapter 5. COVID 19 Impact on U.S. Dental Clearing Houses Market
5.1. COVID-19 Landscape: U.S. Dental Clearing Houses Industry Impact
5.2. COVID 19 - Impact Assessment for the Industry
5.3. COVID 19 Impact: Major Government Policy
5.4. Market Trends and Opportunities in the COVID-19 Landscape
Chapter 6. Market Dynamics Analysis and Trends
6.1. Market Dynamics
6.1.1. Market Drivers
6.1.2. Market Restraints
6.1.3. Market Opportunities
6.2. Porter’s Five Forces Analysis
6.2.1. Bargaining power of suppliers
6.2.2. Bargaining power of buyers
6.2.3. Threat of substitute
6.2.4. Threat of new entrants
6.2.5. Degree of competition
Chapter 7. Competitive Landscape
7.1.1. Company Market Share/Positioning Analysis
7.1.2. Key Strategies Adopted by Players
7.1.3. Vendor Landscape
7.1.3.1. List of Suppliers
7.1.3.2. List of Buyers
Chapter 8. U.S. Dental Clearing Houses Market, By Application
8.1.U.S. Dental Clearing Houses Market, by Application Type, 2024-2033
8.1.1. Claim Submission
8.1.1.1. Market Revenue and Forecast (2021-2033)
8.1.2. Eligibility and Benefit Verification
8.1.2.1. Market Revenue and Forecast (2021-2033)
8.1.3. Claim Status Inquiry
8.1.3.1. Market Revenue and Forecast (2021-2033)
8.1.4. Claim Payment
8.1.4.1. Market Revenue and Forecast (2021-2033)
8.1.5. Remittance Advice
8.1.5.1. Market Revenue and Forecast (2021-2033)
8.1.6. Others
8.1.6.1. Market Revenue and Forecast (2021-2033)
Chapter 9. U.S. Dental Clearing Houses Market, Regional Estimates and Trend Forecast
9.1. U.S.
9.1.1. Market Revenue and Forecast, by Application (2021-2033)
Chapter 10. Company Profiles
10.1. DentalXChange (EDI Health Group, dba)
10.1.1. Company Overview
10.1.2. Product Offerings
10.1.3. Financial Performance
10.1.4. Recent Initiatives
10.2. Dentrix (Henry Schein One)
10.2.1. Company Overview
10.2.2. Product Offerings
10.2.3. Financial Performance
10.2.4. Recent Initiatives
10.3. Change Healthcare
10.3.1. Company Overview
10.3.2. Product Offerings
10.3.3. Financial Performance
10.3.4. Recent Initiatives
10.4. Vyne Dental (Napa EA/MEDX LLC)
10.4.1. Company Overview
10.4.2. Product Offerings
10.4.3. Financial Performance
10.4.4. Recent Initiatives
10.5. Electronic Dental Services
10.5.1. Company Overview
10.5.2. Product Offerings
10.5.3. Financial Performance
10.5.4. Recent Initiatives
Chapter 11. Research Methodology
11.1. Primary Research
11.2. Secondary Research
11.3. Assumptions
Chapter 12. Appendix
12.1. About Us
12.2. Glossary of Terms
 Cross-segment Market Size and Analysis for
Mentioned Segments
 Additional Company Profiles (Upto 5 With No Cost)
 Additional Countries (Apart From Mentioned Countries)
 Country/Region-specific Report
 Go To Market Strategy
 Region Specific Market Dynamics
 Region Level Market Share
 Import Export Analysis
 Production Analysis
 Others