U.S. Physical Therapy Services Market Size, Trends, Share, Growth | Report 2023-2032
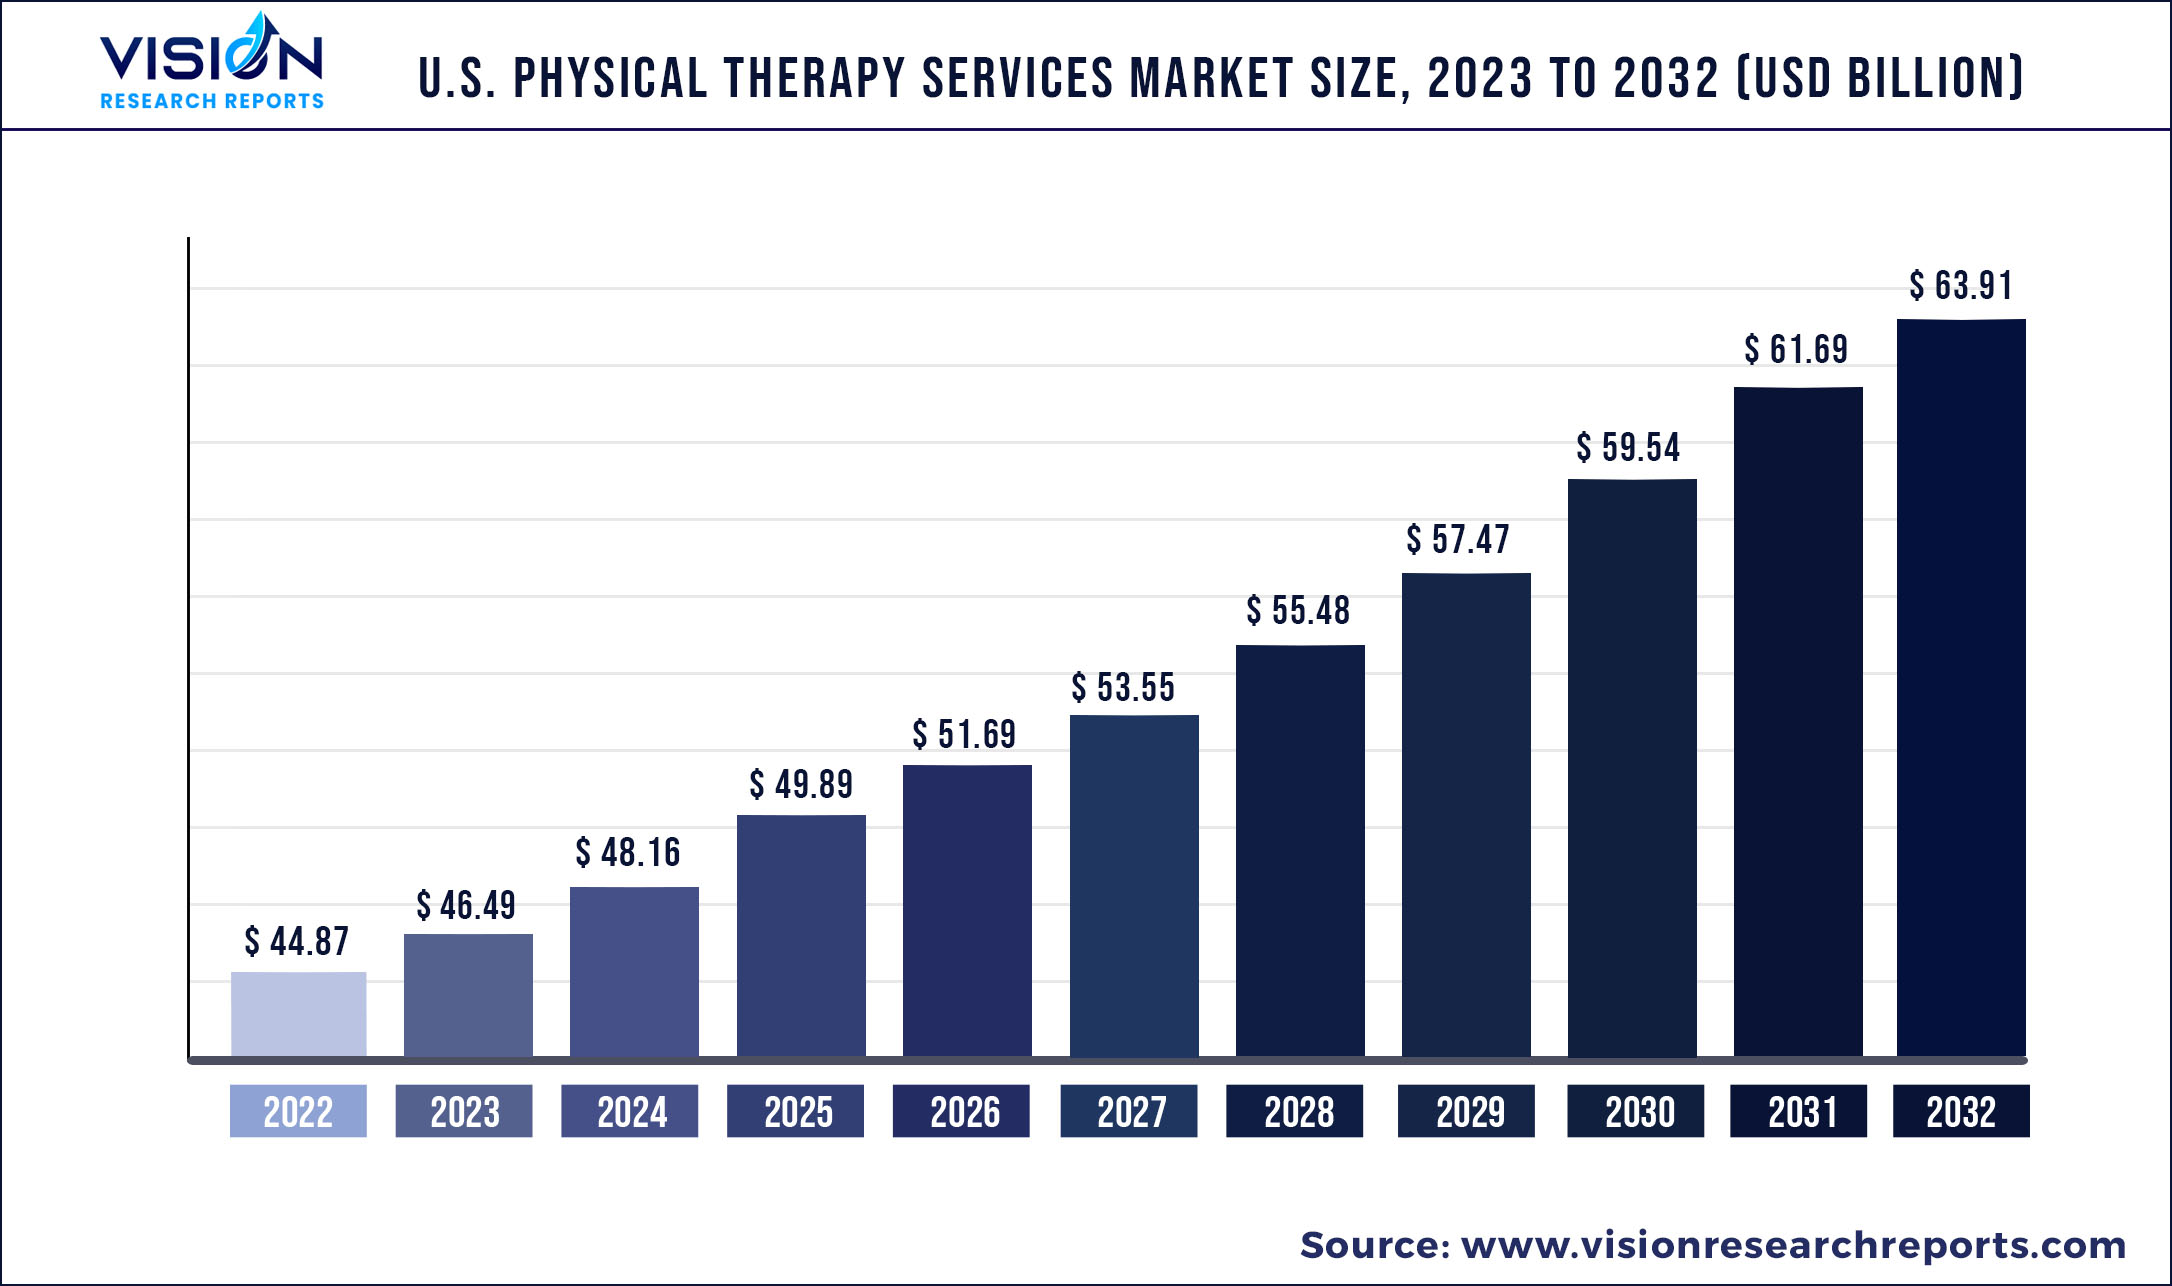
The U.S. physical therapy services market was surpassed at USD 44.87 billion in 2022 and is expected to hit around USD 63.91 billion by 2032, growing at a CAGR of 3.6% from 2023 to 2032.
Key Pointers
| Report Coverage | Details |
| Market Size in 2022 | USD 44.87 billion |
| Revenue Forecast by 2032 | USD 63.91 billion |
| Growth rate from 2023 to 2032 | CAGR of 3.6% |
| Base Year | 2022 |
| Forecast Period | 2023 to 2032 |
| Companies Covered | U.S. Physical Therapy, Inc.; Select Physical Therapy; ATI Physical Therapy; Athletico Physical Therapy; Drayer Physical Therapy Institute; NovaCare Rehabilitation; Professional Physical Therapy; CORA Health Services, Inc.; PT SOLUTIONS; Boston Children’s Hospital |
Physical Therapy (PT) is witnessing high demand in the U.S. due to significant cost savings, growing cases of sports injuries, and the rising prevalence of chronic pain. In addition, favorable reimbursement policies, a growing awareness about the benefits of occupational and physical therapies, and a rising number of physical therapists are contributing to the adoption of these services. Moreover, it is a growing profession in the U.S.
According to the American Physical Therapy Association, there were 312,716 licensed physical therapists in 2019. California, Texas, and New York have the highest number of physical therapists. The use of PT to improve the quality of life of individuals suffering from a variety of diseases, including musculoskeletal, cardiovascular, sports injuries, and others, is a significant factor contributing to the growth of the industry. The therapists provide an array of treatments to help alleviate, avert, and manage the conditions. In addition, these therapies prevent temporary impairments from becoming chronic conditions.
According to the U.S. Bureau of Labor Statistics, 2.6 million nonfatal workplace injuries and illnesses occurred in 2021 in the private sector. Approximately 2.7 people per 100 workers were injured on the job. It is anticipated that the increasing cases of workplace-related injuries will boost the demand for occupational therapies, thereby driving industry growth. The COVID-19 pandemic had a significant effect on the industry. Cancellation of non-essential procedures, a decline in patient numbers, and temporary closure of outpatient PT clinics hampered the industry.
According to a report by the Center for Health Workforce Studies, between 65 and 72% of elective surgeries were temporarily halted or canceled in March and April of 2020 compared to the same period in 2019. Orthopedic procedures requiring physical therapy, such as knee and hip replacements, were the most frequently postponed or rescheduled procedures. Despite lockdowns, telerehabilitation has been very useful in providing virtual care to patients. Moreover, due to the COVID-19 emergency, policy modifications have enabled a rise in telehealth adoption. In March 2020, legislation changes permitted physical therapists to bill Medicare for telehealth services at the same rate as in-person services.
U.S. Physical Therapy Services Market Segmentations:
| By Application | By Payer | By Settings |
|
Orthopedic Therapy Geriatric Therapy Cardiopulmonary Therapy Pediatric Therapy Neurological Therapy Women’s Health Others |
Public Insurance Private Insurance Out of Pocket |
Hospitals Outpatient Clinics Home Healthcare Others |
Chapter 1. Introduction
1.1. Research Objective
1.2. Scope of the Study
1.3. Definition
Chapter 2. Research Methodology
2.1. Research Approach
2.2. Data Sources
2.3. Assumptions & Limitations
Chapter 3. Executive Summary
3.1. Market Snapshot
Chapter 4. Market Variables and Scope
4.1. Introduction
4.2. Market Classification and Scope
4.3. Industry Value Chain Analysis
4.3.1. Raw Material Procurement Analysis
4.3.2. Sales and Distribution Channel Analysis
4.3.3. Downstream Buyer Analysis
Chapter 5. COVID 19 Impact on U.S. Physical Therapy Services Market
5.1. COVID-19 Landscape: U.S. Physical Therapy Services Industry Impact
5.2. COVID 19 - Impact Assessment for the Industry
5.3. COVID 19 Impact: Major Government Policy
5.4. Market Trends and Opportunities in the COVID-19 Landscape
Chapter 6. Market Dynamics Analysis and Trends
6.1. Market Dynamics
6.1.1. Market Drivers
6.1.2. Market Restraints
6.1.3. Market Opportunities
6.2. Porter’s Five Forces Analysis
6.2.1. Bargaining power of suppliers
6.2.2. Bargaining power of buyers
6.2.3. Threat of substitute
6.2.4. Threat of new entrants
6.2.5. Degree of competition
Chapter 7. Competitive Landscape
7.1.1. Company Market Share/Positioning Analysis
7.1.2. Key Strategies Adopted by Players
7.1.3. Vendor Landscape
7.1.3.1. List of Suppliers
7.1.3.2. List of Buyers
Chapter 8. U.S. Physical Therapy Services Market, By Application
8.1. U.S. Physical Therapy Services Market, by Application, 2023-2032
8.1.1 Orthopedic Therapy
8.1.1.1. Market Revenue and Forecast (2019-2032)
8.1.2. Geriatric Therapy
8.1.2.1. Market Revenue and Forecast (2019-2032)
8.1.3. Cardiopulmonary Therapy
8.1.3.1. Market Revenue and Forecast (2019-2032)
8.1.4. Pediatric Therapy
8.1.4.1. Market Revenue and Forecast (2019-2032)
8.1.5. Neurological Therapy
8.1.5.1. Market Revenue and Forecast (2019-2032)
8.1.6. Women’s Health
8.1.6.1. Market Revenue and Forecast (2019-2032)
8.1.7. Others
8.1.7.1. Market Revenue and Forecast (2019-2032)
Chapter 9. U.S. Physical Therapy Services Market, By Payer
9.1. U.S. Physical Therapy Services Market, by Payer, 2023-2032
9.1.1. Public Insurance
9.1.1.1. Market Revenue and Forecast (2019-2032)
9.1.2. Private Insurance
9.1.2.1. Market Revenue and Forecast (2019-2032)
9.1.3. Out of Pocket
9.1.3.1. Market Revenue and Forecast (2019-2032)
Chapter 10. U.S. Physical Therapy Services Market, By Settings
10.1. U.S. Physical Therapy Services Market, by Settings, 2023-2032
10.1.1. Hospitals
10.1.1.1. Market Revenue and Forecast (2019-2032)
10.1.2. Outpatient Clinics
10.1.2.1. Market Revenue and Forecast (2019-2032)
10.1.3. Home Healthcare
10.1.3.1. Market Revenue and Forecast (2019-2032)
10.1.4. Others
10.1.4.1. Market Revenue and Forecast (2019-2032)
Chapter 11. U.S. Physical Therapy Services Market, Regional Estimates and Trend Forecast
11.1. U.S.
11.1.1. Market Revenue and Forecast, by Application (2019-2032)
11.1.2. Market Revenue and Forecast, by Payer (2019-2032)
11.1.3. Market Revenue and Forecast, by Settings (2019-2032)
Chapter 12. Company Profiles
12.1. U.S. Physical Therapy, Inc.
12.1.1. Company Overview
12.1.2. Product Offerings
12.1.3. Financial Performance
12.1.4. Recent Initiatives
12.2. Select Physical Therapy
12.2.1. Company Overview
12.2.2. Product Offerings
12.2.3. Financial Performance
12.2.4. Recent Initiatives
12.3. ATI Physical Therapy
12.3.1. Company Overview
12.3.2. Product Offerings
12.3.3. Financial Performance
12.3.4. Recent Initiatives
12.4. Athletico Physical Therapy
12.4.1. Company Overview
12.4.2. Product Offerings
12.4.3. Financial Performance
12.4.4. Recent Initiatives
12.5. Drayer Physical Therapy Institute
12.5.1. Company Overview
12.5.2. Product Offerings
12.5.3. Financial Performance
12.5.4. Recent Initiatives
12.6. NovaCare Rehabilitation
12.6.1. Company Overview
12.6.2. Product Offerings
12.6.3. Financial Performance
12.6.4. Recent Initiatives
12.7. Professional Physical Therapy
12.7.1. Company Overview
12.7.2. Product Offerings
12.7.3. Financial Performance
12.7.4. Recent Initiatives
12.8. CORA Health Services, Inc.
12.8.1. Company Overview
12.8.2. Product Offerings
12.8.3. Financial Performance
12.8.4. Recent Initiatives
12.9. PT SOLUTIONS
12.9.1. Company Overview
12.9.2. Product Offerings
12.9.3. Financial Performance
12.9.4. Recent Initiatives
12.10. Boston Children’s Hospital
12.10.1. Company Overview
12.10.2. Product Offerings
12.10.3. Financial Performance
12.10.4. Recent Initiatives
Chapter 13. Research Methodology
13.1. Primary Research
13.2. Secondary Research
13.3. Assumptions
Chapter 14. Appendix
14.1. About Us
14.2. Glossary of Terms
 Cross-segment Market Size and Analysis for
Mentioned Segments
Additional Company Profiles (Upto 5 With No Cost)
Additional Countries (Apart From Mentioned Countries)
Country/Region-specific Report
Go To Market Strategy
Region Specific Market DynamicsRegion Level Market Share Import Export AnalysisProduction AnalysisOthers
Cross-segment Market Size and Analysis for
Mentioned Segments
Additional Company Profiles (Upto 5 With No Cost)
Additional Countries (Apart From Mentioned Countries)
Country/Region-specific Report
Go To Market Strategy
Region Specific Market DynamicsRegion Level Market Share Import Export AnalysisProduction AnalysisOthers