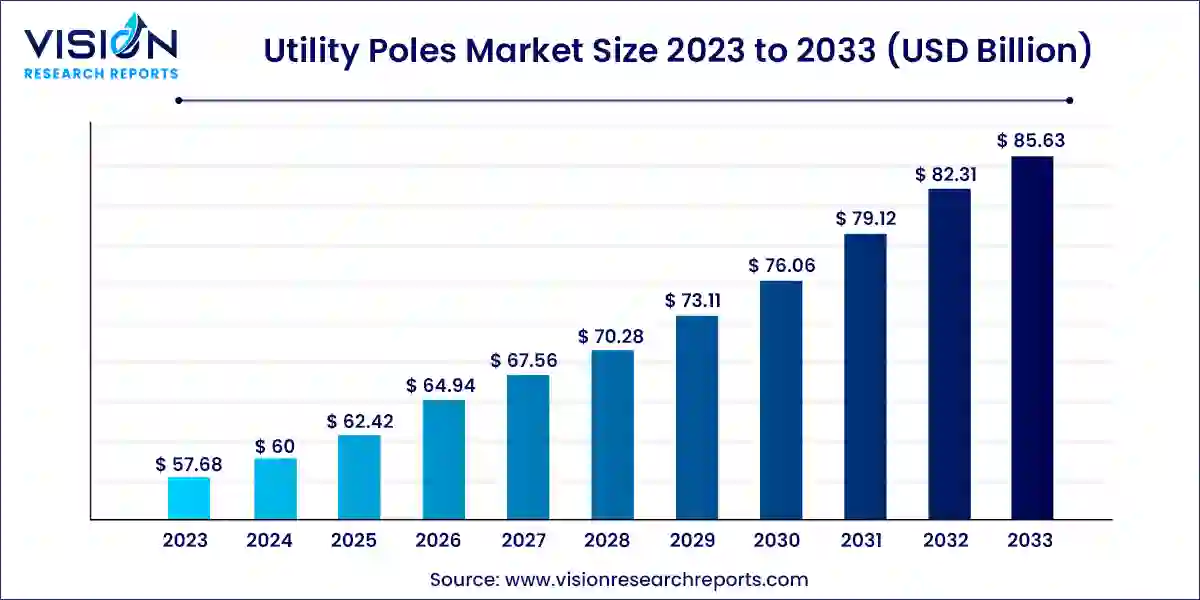
The global utility poles market size was estimated at around USD 57.68 billion in 2023 and it is projected to hit around USD 85.63 billion by 2033, growing at a CAGR of 4.03% from 2024 to 2033.

The utility poles market plays a crucial role in supporting the infrastructure for electricity transmission and distribution across various regions. These tall structures, typically made from wood, steel, or concrete, are essential in carrying power lines and cables over long distances, ensuring reliable electricity supply to homes, businesses, and industries.
The utility poles market is experiencing growth due to the urbanization and industrialization in developing countries are increasing the demand for electricity, driving the expansion of electricity transmission and distribution networks. Additionally, aging infrastructure in developed regions necessitates the replacement and upgrading of utility poles, contributing to market growth. Wood remains a dominant material due to its cost-effectiveness and durability, although there is a growing trend towards steel and concrete poles for their longer lifespan and lower maintenance requirements. Geographically, North America and Europe lead due to extensive electricity grid networks and ongoing modernization efforts, while Asia Pacific is seeing rapid growth with increased investments in power infrastructure. Overall, these factors are propelling the utility poles market forward, promising sustained expansion in the coming years.
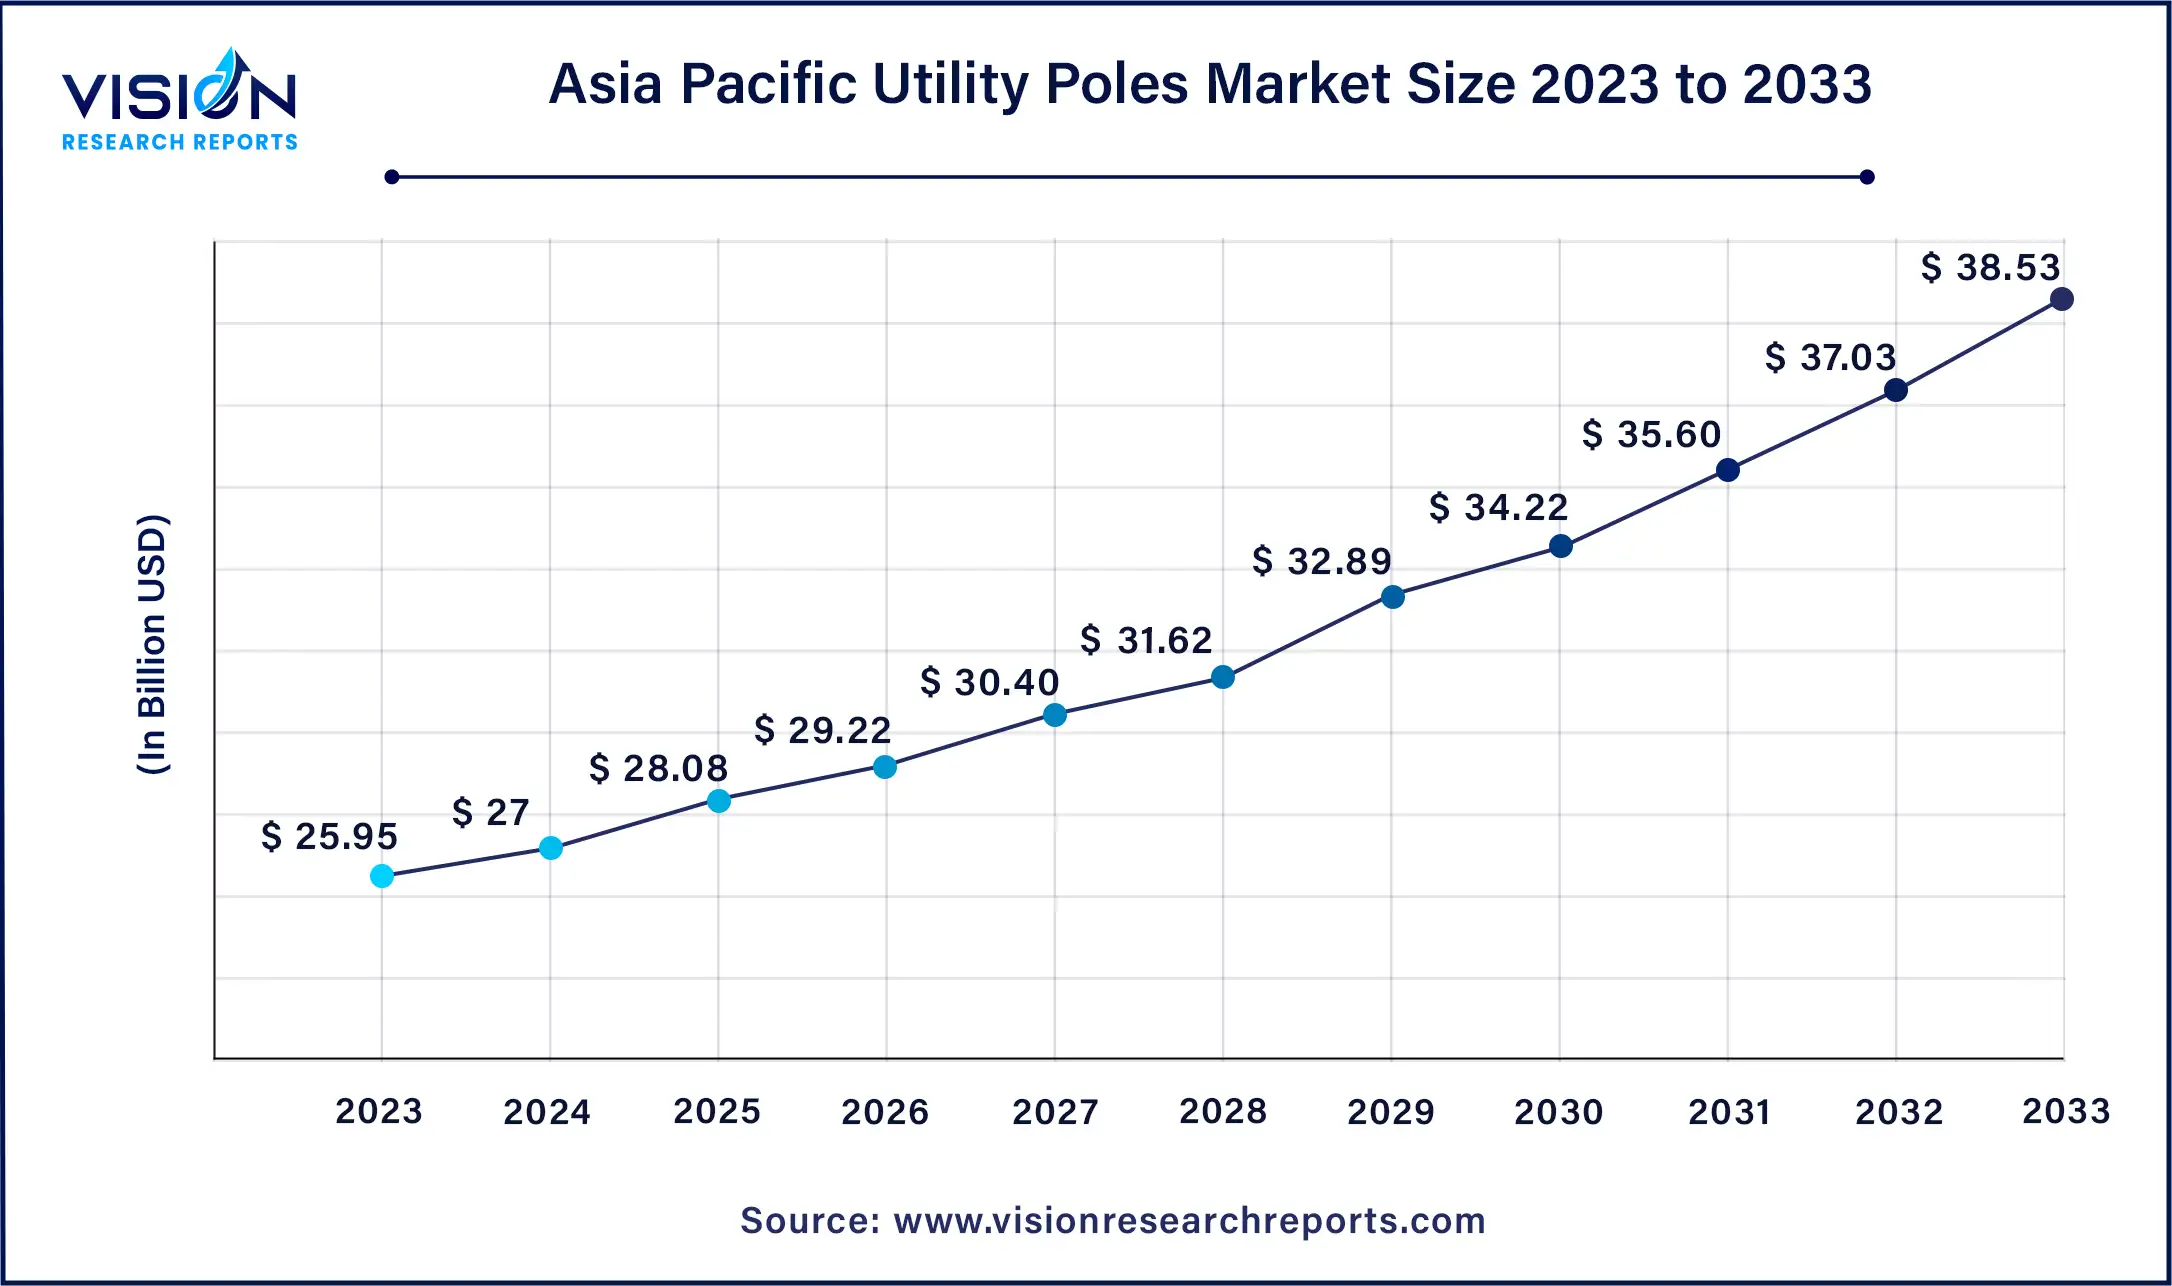
The Asia Pacific utility poles market size was valued at around USD 25.95 billion in 2023 and is projected to hit around USD 38.53 billion by 2033, growing at a CAGR of 4.03% from 2024 to 2033.

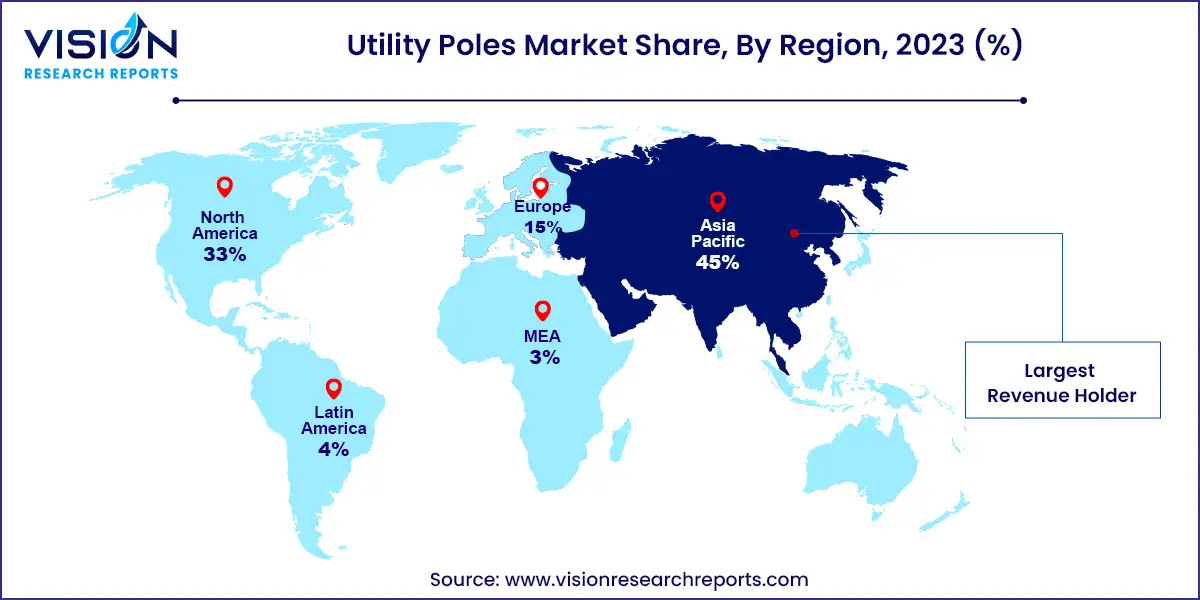
The Asia Pacific market dominated with a revenue share of 45% in 2023 and is expected to grow at a robust CAGR of 4.93% from 2024 to 2033. Rapid urbanization, industrialization, and infrastructure expansion across the region are fueling demand for utility poles. Population growth and economic development in Asia Pacific countries are driving increased demand for electricity and utility services, further boosting the market for utility poles.

North America held a significant market share of over 22% in 2023, driven by increasing urbanization and industrial growth. As cities expand and industries develop, the demand for efficient and reliable power distribution networks grows, bolstering the market for utility poles.
The transmission and distribution pole segment held the largest market share in 2023, accounting for 64% of total revenue. This dominance reflects global efforts to upgrade aging infrastructure to meet modern efficiency and reliability standards. Many countries are prioritizing the refurbishment and replacement of old transmission and distribution lines, necessitating new pole installations. The expansion of electrical grids to support growing populations and rising electricity demands, particularly in developing regions, is further driving the demand for transmission and distribution poles.
The light pole segment is projected to achieve the highest compound annual growth rate (CAGR) of 5.13% from 2024 to 2033. Increasing emphasis on energy efficiency and sustainability has spurred widespread adoption of LED lighting, prompting utilities to modernize their infrastructure with contemporary light poles. Urbanization and infrastructure development initiatives worldwide are also driving the installation of new lighting systems, thereby boosting demand for light poles. Advances in materials and manufacturing processes have enhanced the durability, cost-effectiveness, and aesthetic appeal of light poles, contributing to market expansion.
The electricity distribution segment dominated the market in 2023, driven by urban expansion and rural electrification projects. Additionally, the integration of renewable energy sources like wind and solar into the grid requires additional utility poles to support existing transmission and distribution infrastructure. Advancements in technology, such as smart grid systems and electric vehicle charging stations, necessitate a robust network of utility poles for efficient operation.
The lighting segment is anticipated to experience the fastest growth from 2024 to 2033. The integration of lighting applications into utility poles is driven by urban expansion and modernization efforts. Increasing demand for smart infrastructure solutions is prompting utilities to seek multifunctional utility poles. Lighting applications improve visibility and security, facilitating pedestrian and vehicular traffic flow, especially in densely populated areas. Moreover, the rise of the Internet of Things (IoT) and smart city initiatives further enhances the utility of poles for innovative lighting applications such as remote monitoring, data collection, and adaptive lighting.
In 2023, the 6m to 15m segment dominated the market in terms of revenue share. Increasing adoption of renewable energy sources and stringent safety regulations are driving demand for utility poles within this size range. Technological advancements in lightweight yet durable materials are also contributing to the segment's growth by offering cost-effective and sustainable solutions.
The 15m to 24m segment is expected to achieve significant growth from 2024 to 2033. Advances in materials like composites and treated wood enable the construction of taller, stronger utility poles capable of withstanding environmental challenges. Stringent regulations regarding infrastructure reliability are motivating utilities to invest in taller poles that minimize downtime and ensure operational continuity.
New installations dominated the market in 2023 and are expected to continue leading through 2033. Utilities' focus on modernizing and expanding electricity networks, driven by urbanization and industrialization, fuels demand for new utility poles. Replacement of aging poles with more durable materials such as composites or steel also contributes to market growth.
The replacement segment is projected to grow at the fastest CAGR from 2024 to 2033, driven by the need to modernize aging infrastructure. Technological advancements in materials and construction methods are encouraging utilities to replace older poles with more efficient alternatives, ensuring the reliability and safety of power distribution networks.
By Product
By Application
By Size
By End-use
By Region
Chapter 1. Introduction
1.1. Research Objective
1.2. Scope of the Study
1.3. Definition
Chapter 2. Research Methodology
2.1. Research Approach
2.2. Data Sources
2.3. Assumptions & Limitations
Chapter 3. Executive Summary
3.1. Market Snapshot
Chapter 4. Market Variables and Scope
4.1. Introduction
4.2. Market Classification and Scope
4.3. Industry Value Chain Analysis
4.3.1. Raw Material Procurement Analysis
4.3.2. Sales and Distribution Channel Analysis
4.3.3. Downstream Buyer Analysis
Chapter 5. COVID 19 Impact on Utility Poles Market
5.1. COVID-19 Landscape: Utility Poles Industry Impact
5.2. COVID 19 - Impact Assessment for the Industry
5.3. COVID 19 Impact: Global Major Government Policy
5.4. Market Trends and Opportunities in the COVID-19 Landscape
Chapter 6. Market Dynamics Analysis and Trends
6.1. Market Dynamics
6.1.1. Market Drivers
6.1.2. Market Restraints
6.1.3. Market Opportunities
6.2. Porter’s Five Forces Analysis
6.2.1. Bargaining power of suppliers
6.2.2. Bargaining power of buyers
6.2.3. Threat of substitute
6.2.4. Threat of new entrants
6.2.5. Degree of competition
Chapter 7. Competitive Landscape
7.1.1. Company Market Share/Positioning Analysis
7.1.2. Key Strategies Adopted by Players
7.1.3. Vendor Landscape
7.1.3.1. List of Suppliers
7.1.3.2. List of Buyers
Chapter 8. Global Utility Poles Market, By Product
8.1. Utility Poles Market, by Product, 2024-2033
8.1.1. Transmission & Distribution Pole
8.1.1.1. Market Revenue and Forecast (2021-2033)
8.1.2. Steel
8.1.2.1. Market Revenue and Forecast (2021-2033)
8.1.3. Concrete
8.1.3.1. Market Revenue and Forecast (2021-2033)
8.1.4. Wood
8.1.4.1. Market Revenue and Forecast (2021-2033)
8.1.5. Composite
8.1.5.1. Market Revenue and Forecast (2021-2033)
8.1.6. Light Pole
8.1.6.1. Market Revenue and Forecast (2021-2033)
8.1.7. High Mast Pole
8.1.7.1. Market Revenue and Forecast (2021-2033)
8.1.8. Monopole
8.1.8.1. Market Revenue and Forecast (2021-2033)
8.1.9. Others
8.1.9.1. Market Revenue and Forecast (2021-2033)
Chapter 9. Global Utility Poles Market, By Application
9.1. Utility Poles Market, by Application, 2024-2033
9.1.1. Electricity Transmission
9.1.1.1. Market Revenue and Forecast (2021-2033)
9.1.2. Electricity Distribution
9.1.2.1. Market Revenue and Forecast (2021-2033)
9.1.3. Lighting
9.1.3.1. Market Revenue and Forecast (2021-2033)
9.1.4. Telecommunication
9.1.4.1. Market Revenue and Forecast (2021-2033)
9.1.5. Others
9.1.5.1. Market Revenue and Forecast (2021-2033)
Chapter 10. Global Utility Poles Market, By Size
10.1. Utility Poles Market, by Size, 2024-2033
10.1.1. Less than 6m
10.1.1.1. Market Revenue and Forecast (2021-2033)
10.1.2. 6m to 15m
10.1.2.1. Market Revenue and Forecast (2021-2033)
10.1.3. 15m to 24m
10.1.3.1. Market Revenue and Forecast (2021-2033)
10.1.4. Above 24m
10.1.4.1. Market Revenue and Forecast (2021-2033)
Chapter 11. Global Utility Poles Market, By End-use
11.1. Utility Poles Market, by End-use, 2024-2033
11.1.1. New Installations
11.1.1.1. Market Revenue and Forecast (2021-2033)
11.1.2. Replacement
11.1.2.1. Market Revenue and Forecast (2021-2033)
Chapter 12. Global Utility Poles Market, Regional Estimates and Trend Forecast
12.1. North America
12.1.1. Market Revenue and Forecast, by Product (2021-2033)
12.1.2. Market Revenue and Forecast, by Application (2021-2033)
12.1.3. Market Revenue and Forecast, by Size (2021-2033)
12.1.4. Market Revenue and Forecast, by End-use (2021-2033)
12.1.5. U.S.
12.1.5.1. Market Revenue and Forecast, by Product (2021-2033)
12.1.5.2. Market Revenue and Forecast, by Application (2021-2033)
12.1.5.3. Market Revenue and Forecast, by Size (2021-2033)
12.1.5.4. Market Revenue and Forecast, by End-use (2021-2033)
12.1.6. Rest of North America
12.1.6.1. Market Revenue and Forecast, by Product (2021-2033)
12.1.6.2. Market Revenue and Forecast, by Application (2021-2033)
12.1.6.3. Market Revenue and Forecast, by Size (2021-2033)
12.1.6.4. Market Revenue and Forecast, by End-use (2021-2033)
12.2. Europe
12.2.1. Market Revenue and Forecast, by Product (2021-2033)
12.2.2. Market Revenue and Forecast, by Application (2021-2033)
12.2.3. Market Revenue and Forecast, by Size (2021-2033)
12.2.4. Market Revenue and Forecast, by End-use (2021-2033)
12.2.5. UK
12.2.5.1. Market Revenue and Forecast, by Product (2021-2033)
12.2.5.2. Market Revenue and Forecast, by Application (2021-2033)
12.2.5.3. Market Revenue and Forecast, by Size (2021-2033)
12.2.5.4. Market Revenue and Forecast, by End-use (2021-2033)
12.2.6. Germany
12.2.6.1. Market Revenue and Forecast, by Product (2021-2033)
12.2.6.2. Market Revenue and Forecast, by Application (2021-2033)
12.2.6.3. Market Revenue and Forecast, by Size (2021-2033)
12.2.6.4. Market Revenue and Forecast, by End-use (2021-2033)
12.2.7. France
12.2.7.1. Market Revenue and Forecast, by Product (2021-2033)
12.2.7.2. Market Revenue and Forecast, by Application (2021-2033)
12.2.7.3. Market Revenue and Forecast, by Size (2021-2033)
12.2.7.4. Market Revenue and Forecast, by End-use (2021-2033)
12.2.8. Rest of Europe
12.2.8.1. Market Revenue and Forecast, by Product (2021-2033)
12.2.8.2. Market Revenue and Forecast, by Application (2021-2033)
12.2.8.3. Market Revenue and Forecast, by Size (2021-2033)
12.2.8.4. Market Revenue and Forecast, by End-use (2021-2033)
12.3. APAC
12.3.1. Market Revenue and Forecast, by Product (2021-2033)
12.3.2. Market Revenue and Forecast, by Application (2021-2033)
12.3.3. Market Revenue and Forecast, by Size (2021-2033)
12.3.4. Market Revenue and Forecast, by End-use (2021-2033)
12.3.5. India
12.3.5.1. Market Revenue and Forecast, by Product (2021-2033)
12.3.5.2. Market Revenue and Forecast, by Application (2021-2033)
12.3.5.3. Market Revenue and Forecast, by Size (2021-2033)
12.3.5.4. Market Revenue and Forecast, by End-use (2021-2033)
12.3.6. China
12.3.6.1. Market Revenue and Forecast, by Product (2021-2033)
12.3.6.2. Market Revenue and Forecast, by Application (2021-2033)
12.3.6.3. Market Revenue and Forecast, by Size (2021-2033)
12.3.6.4. Market Revenue and Forecast, by End-use (2021-2033)
12.3.7. Japan
12.3.7.1. Market Revenue and Forecast, by Product (2021-2033)
12.3.7.2. Market Revenue and Forecast, by Application (2021-2033)
12.3.7.3. Market Revenue and Forecast, by Size (2021-2033)
12.3.7.4. Market Revenue and Forecast, by End-use (2021-2033)
12.3.8. Rest of APAC
12.3.8.1. Market Revenue and Forecast, by Product (2021-2033)
12.3.8.2. Market Revenue and Forecast, by Application (2021-2033)
12.3.8.3. Market Revenue and Forecast, by Size (2021-2033)
12.3.8.4. Market Revenue and Forecast, by End-use (2021-2033)
12.4. MEA
12.4.1. Market Revenue and Forecast, by Product (2021-2033)
12.4.2. Market Revenue and Forecast, by Application (2021-2033)
12.4.3. Market Revenue and Forecast, by Size (2021-2033)
12.4.4. Market Revenue and Forecast, by End-use (2021-2033)
12.4.5. GCC
12.4.5.1. Market Revenue and Forecast, by Product (2021-2033)
12.4.5.2. Market Revenue and Forecast, by Application (2021-2033)
12.4.5.3. Market Revenue and Forecast, by Size (2021-2033)
12.4.5.4. Market Revenue and Forecast, by End-use (2021-2033)
12.4.6. North Africa
12.4.6.1. Market Revenue and Forecast, by Product (2021-2033)
12.4.6.2. Market Revenue and Forecast, by Application (2021-2033)
12.4.6.3. Market Revenue and Forecast, by Size (2021-2033)
12.4.6.4. Market Revenue and Forecast, by End-use (2021-2033)
12.4.7. South Africa
12.4.7.1. Market Revenue and Forecast, by Product (2021-2033)
12.4.7.2. Market Revenue and Forecast, by Application (2021-2033)
12.4.7.3. Market Revenue and Forecast, by Size (2021-2033)
12.4.7.4. Market Revenue and Forecast, by End-use (2021-2033)
12.4.8. Rest of MEA
12.4.8.1. Market Revenue and Forecast, by Product (2021-2033)
12.4.8.2. Market Revenue and Forecast, by Application (2021-2033)
12.4.8.3. Market Revenue and Forecast, by Size (2021-2033)
12.4.8.4. Market Revenue and Forecast, by End-use (2021-2033)
12.5. Latin America
12.5.1. Market Revenue and Forecast, by Product (2021-2033)
12.5.2. Market Revenue and Forecast, by Application (2021-2033)
12.5.3. Market Revenue and Forecast, by Size (2021-2033)
12.5.4. Market Revenue and Forecast, by End-use (2021-2033)
12.5.5. Brazil
12.5.5.1. Market Revenue and Forecast, by Product (2021-2033)
12.5.5.2. Market Revenue and Forecast, by Application (2021-2033)
12.5.5.3. Market Revenue and Forecast, by Size (2021-2033)
12.5.5.4. Market Revenue and Forecast, by End-use (2021-2033)
12.5.6. Rest of LATAM
12.5.6.1. Market Revenue and Forecast, by Product (2021-2033)
12.5.6.2. Market Revenue and Forecast, by Application (2021-2033)
12.5.6.3. Market Revenue and Forecast, by Size (2021-2033)
12.5.6.4. Market Revenue and Forecast, by End-use (2021-2033)
Chapter 13. Company Profiles
13.1. Al-Babtain Power & Telecom
13.1.1. Company Overview
13.1.2. Product Offerings
13.1.3. Financial Performance
13.1.4. Recent Initiatives
13.2. American Timber and Steel
13.2.1. Company Overview
13.2.2. Product Offerings
13.2.3. Financial Performance
13.2.4. Recent Initiatives
13.3. Bell Lumber & Pole
13.3.1. Company Overview
13.3.2. Product Offerings
13.3.3. Financial Performance
13.3.4. Recent Initiatives
13.4. Energya Steel-KSA
13.4.1. Company Overview
13.4.2. Product Offerings
13.4.3. Financial Performance
13.4.4. Recent Initiatives
13.5. Europoles Middle East LLC
13.5.1. Company Overview
13.5.2. Product Offerings
13.5.3. Financial Performance
13.5.4. Recent Initiatives
13.6. Frank R. Close & Son, Inc.
13.6.1. Company Overview
13.6.2. Product Offerings
13.6.3. Financial Performance
13.6.4. Recent Initiatives
13.7. NATIONAL COMPANY FOR GALVANIZING AND STEEL POLES (GALVANCO)
13.7.1. Company Overview
13.7.2. Product Offerings
13.7.3. Financial Performance
13.7.4. Recent Initiatives
13.8. George Scott (Geo Stott)
13.8.1. Company Overview
13.8.2. Product Offerings
13.8.3. Financial Performance
13.8.4. Recent Initiatives
13.9. HAS Engineering LLC
13.9.1. Company Overview
13.9.2. Product Offerings
13.9.3. Financial Performance
13.9.4. Recent Initiatives
13.10. Hidada
13.10.1. Company Overview
13.10.2. Product Offerings
13.10.3. Financial Performance
13.10.4. Recent Initiatives
Chapter 14. Research Methodology
14.1. Primary Research
14.2. Secondary Research
14.3. Assumptions
Chapter 15. Appendix
15.1. About Us
15.2. Glossary of Terms
 Cross-segment Market Size and Analysis for
Mentioned Segments
 Additional Company Profiles (Upto 5 With No Cost)
 Additional Countries (Apart From Mentioned Countries)
 Country/Region-specific Report
 Go To Market Strategy
 Region Specific Market Dynamics
 Region Level Market Share
 Import Export Analysis
 Production Analysis
 Others