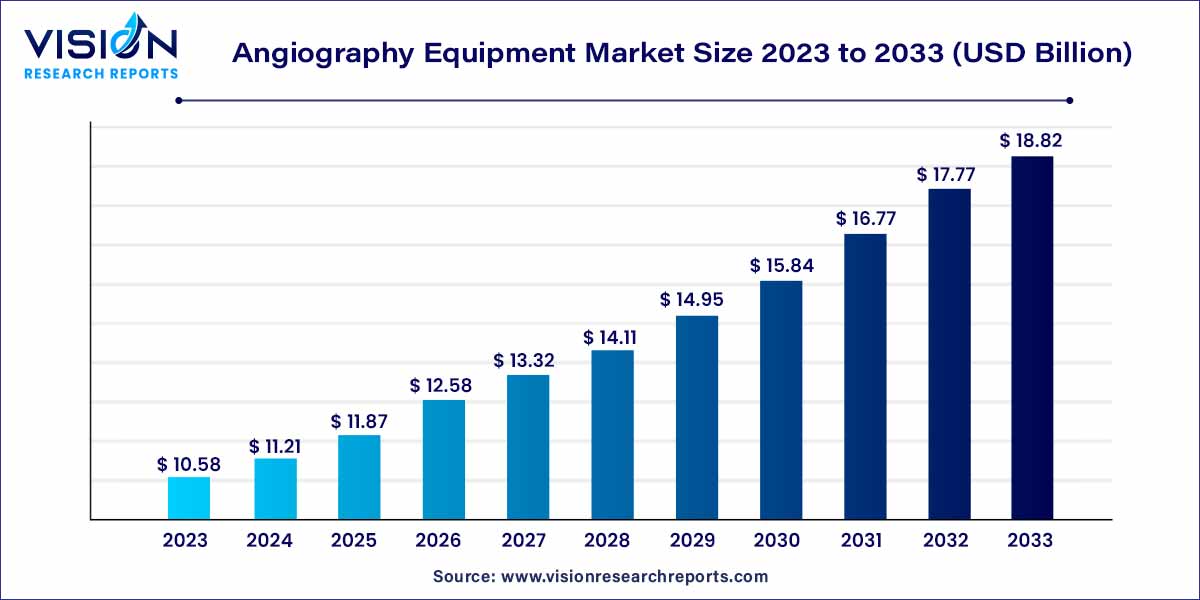
The global angiography equipment market size was estimated at around USD 10.58 billion in 2023 and it is projected to hit around USD 18.82 billion by 2033, growing at a CAGR of 5.93% from 2024 to 2033.

The global angiography equipment market has witnessed significant growth in recent years, driven by advancements in medical imaging technology and an increasing prevalence of cardiovascular diseases. This overview aims to provide insights into the key factors shaping the angiography equipment market, including market trends, growth drivers, challenges, and notable players in the industry.
The Angiography Equipment Market is experiencing robust growth, propelled by several key factors. Technological advancements in medical imaging, including the integration of artificial intelligence and the development of 3D angiography, have significantly enhanced the precision and efficiency of diagnostic procedures. Moreover, the escalating global prevalence of cardiovascular diseases has driven an increased demand for angiography procedures, further contributing to market growth. The rising preference for minimally invasive procedures, which offer quicker recovery times, has also played a pivotal role in fueling the demand for angiography equipment. Additionally, factors such as the aging population, with its heightened susceptibility to cardiovascular ailments, and government initiatives aimed at improving healthcare infrastructure and accessibility to advanced medical technologies, are key drivers fostering the expansion of the angiography equipment market. Despite challenges related to high equipment costs and stringent regulatory approvals, the market's trajectory remains positive, with continuous innovation and collaboration among industry stakeholders contributing to sustained growth.
| Report Coverage | Details |
| Market Revenue by 2033 | USD 18.82 billion |
| Growth Rate from 2024 to 2033 | CAGR of 5.93% |
| Revenue Share of North America in 2023 | 34% |
| CAGR of Asia Pacific from 2024 to 2033 | 6.28% |
| Base Year | 2023 |
| Forecast Period | 2024 to 2033 |
| Market Analysis (Terms Used) | Value (US$ Million/Billion) or (Volume/Units) |
The angiography systems segment led the market with a share of 27% in 2023 due to continuous investments, technological advancements, and growing scope of applications. These systems have evolved from catheter-based minimally invasive procedures to digitalized procedures. In June 2022, MicroPort Scientific Corporation launched the MicroPort Argus optical coherence tomography (OCT) system, featuring OCT as a main endoluminal imaging technology due to its high-resolution feature aiding the customization of treatment for various patients.
The global market is segmented into accessories, systems, guidewires, catheters, balloons, vascular closure devices, and contrast media. Contrast media is expected to be the fastest-growing product segment with a CAGR of 6.35% over the forecast period. These products are widely used for enhancing the visibility of blood vessels in imaging techniques, such as CT angiography, MRA, and X-ray. It is also used in projectional radiography and fluoroscopy. Various radiocontrast agents used are iodine, barium-sulfate, and gadolinium. In November 2022, GE HealthCare announced a USD 80 million investment in expanding its iodinated contrast media production capacity in Norway by 30%, creating 100 new jobs.
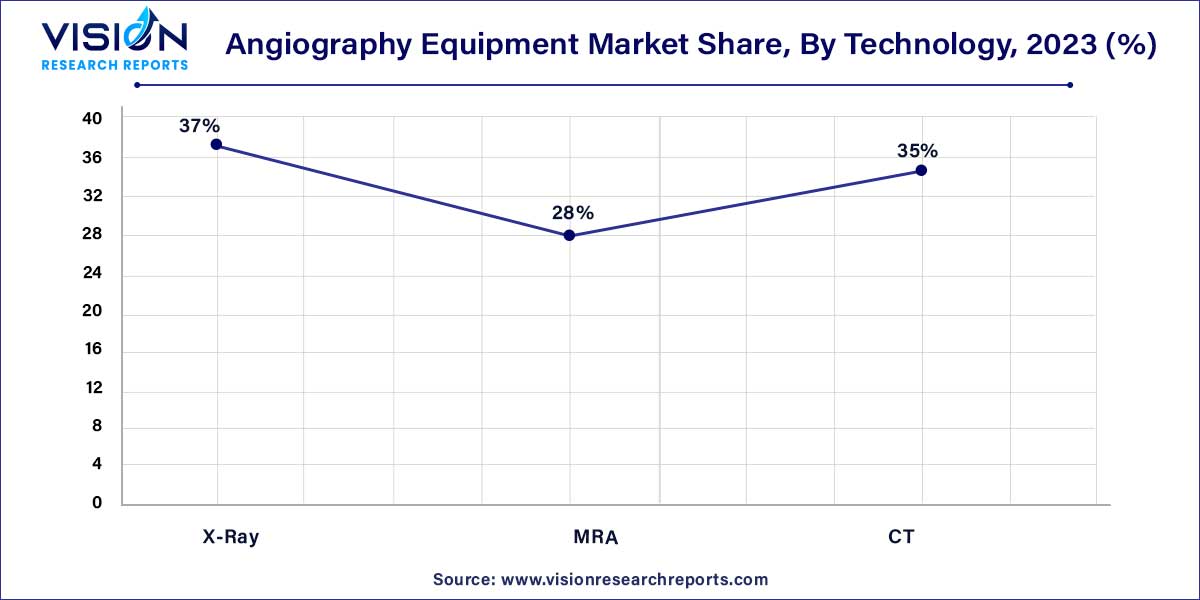
The X-ray segment contributed the largest market share of 37% in 2023. Based on technology, the market is segmented into X-ray, MRA, and CT. Companies are investing heavily in developing new technologies, which is expected to support market growth. The need for reduction of radiation dose, improvement in image quality, and emerging cath lab trends are expected to drive the market. In July 2022, Siemens Healthineers launched Mobilett Impact, a wireless mobile X-ray system, to facilitate scans at the patient’s bedside, increasing the convenience of procedures.

MRA is expected to be the fastest-expanding segment with a CAGR of 6.37% over the forecast period, owing to its advantage of negligible exposure to radiation in the diagnosis of heart disease. MRA offers 3D capabilities to acquire images in any anatomical plane with excellent soft tissue contrast. The emergence of 3.0T MR imaging has significantly enhanced the diagnosis of coronary artery disease. These factors are also said to boost the segment growth.
In June 2022, Siemens Healthineers launched the Artis icono ceiling angiography system, featuring precise tumor embolization and 2D and 3D imaging of tumors. It has multidisciplinary usability and provides seamless integration with third-party software and interfaces.
The coronary angiography segment dominated the market with a share of 46% in 2023. The rising prevalence of Coronary Artery Disease (CAD) and the availability of less-invasive imaging modalities are escalating the demand for coronary angiography in developing countries, such as China and India. As per the Centers for Disease Control and Prevention (CDC), CAD is the most common heart disease, killing 375,476 people in 2021. About 5% of adults are diagnosed with CAD, and around 20% of CAD deaths occur in adults aged less than 65 years.
In terms of procedure, the market is segmented into coronary, endovascular, and neurovascular. Constant developments in imaging technology have enabled better diagnosis of the disease. The imaging skill has observed change from single slice CT to multislice CT, providing excellent visualization and assessment of CAD. A wide range of options available for diagnosis include coronary CT angiography, cardiac Magnetic Resonance Imaging (MRI), cardiac Single Photon Emission Computed Tomography (SPECT), Positron Emission Tomography (PET), and integrated SPECT/CT and PET/CT.
The diagnostic application segment dominated the market with the market share of 59% in 2023 and is expected to witness the fastest CAGR of 6.17% during the forecast period. Developments in CTA and MRA provide appropriate information in cardiology and neurology, such as cerebral aneurysms, acute stroke, brain arteriovenous malformation, dural arteriovenous fistula, suspected cerebral vasculitis, and occlusive diseases.
Rising awareness about CVDs and associated risk factors is expected to drive the market. Globally, CAD accounts for the maximum number of deaths and disabilities. The joint initiatives of the WHO and state governments to increase awareness about heart diseases and their underlying causes are further expected to contribute to the angiography equipment market growth.
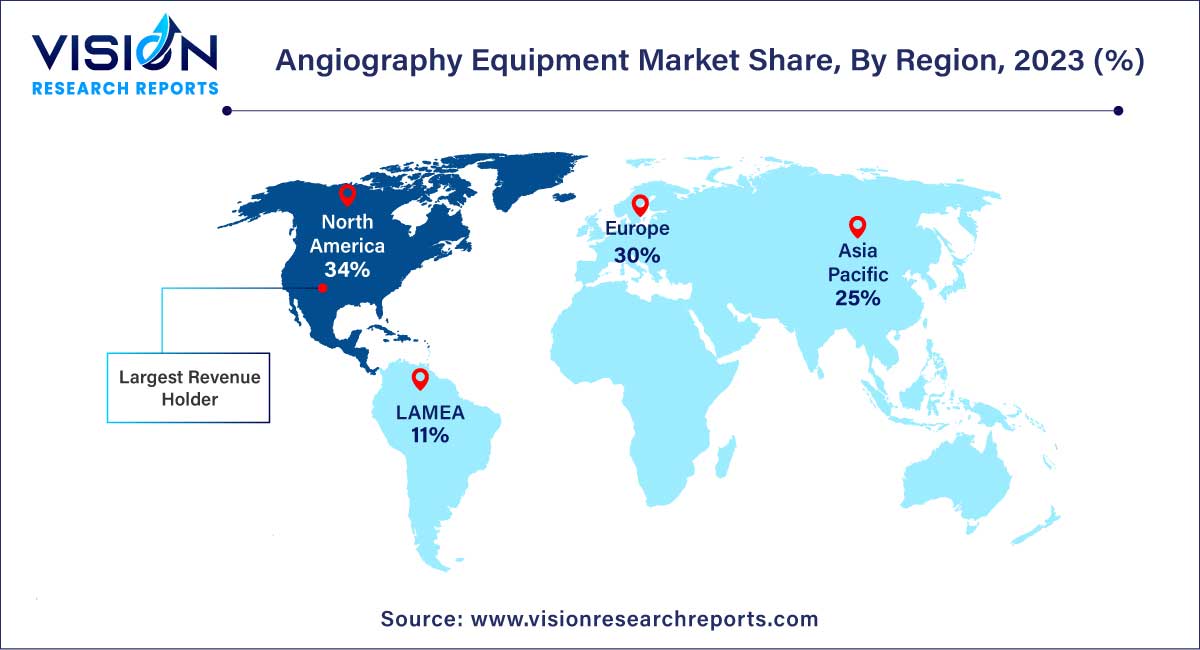
North America led the market with a share of 34% in 2023 and is likely to expand further due to the increasing geriatric population and prevalence of CVDs in the region. The presence of major companies in the U.S. is attributed to the major share of the regional market. Europe is also anticipated to witness significant growth over the coming years due to the presence of a majority of local and foreign manufacturers. Growing demand for advanced medical devices and the prevalence of CVD are expected to drive the regional market.

Asia Pacific is expected to emerge as the fastest-growing region with the largest CAGR of 6.28% over the forecast period. Favorable reimbursement policies promoting technological advancements support the region’s growth. The regulatory scenario is not stringent in countries such as South Korea, Brazil, and India, offering an attractive opportunity for global companies to set their footprints in these markets. China is undergoing consolidation to upgrade the quality of this equipment.
Rising imports from the largest market players, such as GE Healthcare, Siemens Healthcare, and Koninklijke Philips N.V., are fueling the growth of the Chinese angiography market. In December 2020, GE Healthcare launched the latest version of its robotic angiography system Allia IGS 7 angiography system for image-guided therapy, operating on a wheeled gantry for better accessibility and transportability.
By Product
By Technology
By Procedure
By Application
By Region
Chapter 1. Introduction
1.1. Research Objective
1.2. Scope of the Study
1.3. Definition
Chapter 2. Research Methodology
2.1. Research Approach
2.2. Data Sources
2.3. Assumptions & Limitations
Chapter 3. Executive Summary
3.1. Market Snapshot
Chapter 4. Market Variables and Scope
4.1. Introduction
4.2. Market Classification and Scope
4.3. Industry Value Chain Analysis
4.3.1. Raw Material Procurement Analysis
4.3.2. Sales and Distribution Channel Analysis
4.3.3. Downstream Buyer Analysis
Chapter 5. COVID 19 Impact on Angiography Equipment Market
5.1. COVID-19 Landscape: Angiography Equipment Industry Impact
5.2. COVID 19 - Impact Assessment for the Industry
5.3. COVID 19 Impact: Global Major Government Policy
5.4. Market Trends and Opportunities in the COVID-19 Landscape
Chapter 6. Market Dynamics Analysis and Trends
6.1. Market Dynamics
6.1.1. Market Drivers
6.1.2. Market Restraints
6.1.3. Market Opportunities
6.2. Porter’s Five Forces Analysis
6.2.1. Bargaining power of suppliers
6.2.2. Bargaining power of buyers
6.2.3. Threat of substitute
6.2.4. Threat of new entrants
6.2.5. Degree of competition
Chapter 7. Competitive Landscape
7.1.1. Company Market Share/Positioning Analysis
7.1.2. Key Strategies Adopted by Players
7.1.3. Vendor Landscape
7.1.3.1. List of Suppliers
7.1.3.2. List of Buyers
Chapter 8. Global Angiography Equipment Market, By Product
8.1. Angiography Equipment Market, by Product, 2024-2033
8.1.1. Angiography Systems
8.1.1.1. Market Revenue and Forecast (2021-2033)
8.1.2. Catheters
8.1.2.1. Market Revenue and Forecast (2021-2033)
8.1.3. Guidewire
8.1.3.1. Market Revenue and Forecast (2021-2033)
8.1.4. Balloons
8.1.4.1. Market Revenue and Forecast (2021-2033)
8.1.5. Contrast Media
8.1.5.1. Market Revenue and Forecast (2021-2033)
8.1.6. Vascular Closure Devices
8.1.6.1. Market Revenue and Forecast (2021-2033)
8.1.7. Angiography Accessories
8.1.7.1. Market Revenue and Forecast (2021-2033)
Chapter 9. Global Angiography Equipment Market, By Technology
9.1. Angiography Equipment Market, by Technology, 2024-2033
9.1.1. X-Ray
9.1.1.1. Market Revenue and Forecast (2021-2033)
9.1.2. MRA
9.1.2.1. Market Revenue and Forecast (2021-2033)
9.1.3. CT
9.1.3.1. Market Revenue and Forecast (2021-2033)
Chapter 10. Global Angiography Equipment Market, By Procedure
10.1. Angiography Equipment Market, by Procedure, 2024-2033
10.1.1. Coronary
10.1.1.1. Market Revenue and Forecast (2021-2033)
10.1.2. Endovascular
10.1.2.1. Market Revenue and Forecast (2021-2033)
10.1.3. Neurovascular
10.1.3.1. Market Revenue and Forecast (2021-2033)
Chapter 11. Global Angiography Equipment Market, By Application
11.1. Angiography Equipment Market, by Application, 2024-2033
11.1.1. Diagnostic
11.1.1.1. Market Revenue and Forecast (2021-2033)
11.1.2. Therapeutic
11.1.2.1. Market Revenue and Forecast (2021-2033)
Chapter 12. Global Angiography Equipment Market, Regional Estimates and Trend Forecast
12.1. North America
12.1.1. Market Revenue and Forecast, by Product (2021-2033)
12.1.2. Market Revenue and Forecast, by Technology (2021-2033)
12.1.3. Market Revenue and Forecast, by Procedure (2021-2033)
12.1.4. Market Revenue and Forecast, by Application (2021-2033)
12.1.5. U.S.
12.1.5.1. Market Revenue and Forecast, by Product (2021-2033)
12.1.5.2. Market Revenue and Forecast, by Technology (2021-2033)
12.1.5.3. Market Revenue and Forecast, by Procedure (2021-2033)
12.1.5.4. Market Revenue and Forecast, by Application (2021-2033)
12.1.6. Rest of North America
12.1.6.1. Market Revenue and Forecast, by Product (2021-2033)
12.1.6.2. Market Revenue and Forecast, by Technology (2021-2033)
12.1.6.3. Market Revenue and Forecast, by Procedure (2021-2033)
12.1.6.4. Market Revenue and Forecast, by Application (2021-2033)
12.2. Europe
12.2.1. Market Revenue and Forecast, by Product (2021-2033)
12.2.2. Market Revenue and Forecast, by Technology (2021-2033)
12.2.3. Market Revenue and Forecast, by Procedure (2021-2033)
12.2.4. Market Revenue and Forecast, by Application (2021-2033)
12.2.5. UK
12.2.5.1. Market Revenue and Forecast, by Product (2021-2033)
12.2.5.2. Market Revenue and Forecast, by Technology (2021-2033)
12.2.5.3. Market Revenue and Forecast, by Procedure (2021-2033)
12.2.5.4. Market Revenue and Forecast, by Application (2021-2033)
12.2.6. Germany
12.2.6.1. Market Revenue and Forecast, by Product (2021-2033)
12.2.6.2. Market Revenue and Forecast, by Technology (2021-2033)
12.2.6.3. Market Revenue and Forecast, by Procedure (2021-2033)
12.2.6.4. Market Revenue and Forecast, by Application (2021-2033)
12.2.7. France
12.2.7.1. Market Revenue and Forecast, by Product (2021-2033)
12.2.7.2. Market Revenue and Forecast, by Technology (2021-2033)
12.2.7.3. Market Revenue and Forecast, by Procedure (2021-2033)
12.2.7.4. Market Revenue and Forecast, by Application (2021-2033)
12.2.8. Rest of Europe
12.2.8.1. Market Revenue and Forecast, by Product (2021-2033)
12.2.8.2. Market Revenue and Forecast, by Technology (2021-2033)
12.2.8.3. Market Revenue and Forecast, by Procedure (2021-2033)
12.2.8.4. Market Revenue and Forecast, by Application (2021-2033)
12.3. APAC
12.3.1. Market Revenue and Forecast, by Product (2021-2033)
12.3.2. Market Revenue and Forecast, by Technology (2021-2033)
12.3.3. Market Revenue and Forecast, by Procedure (2021-2033)
12.3.4. Market Revenue and Forecast, by Application (2021-2033)
12.3.5. India
12.3.5.1. Market Revenue and Forecast, by Product (2021-2033)
12.3.5.2. Market Revenue and Forecast, by Technology (2021-2033)
12.3.5.3. Market Revenue and Forecast, by Procedure (2021-2033)
12.3.5.4. Market Revenue and Forecast, by Application (2021-2033)
12.3.6. China
12.3.6.1. Market Revenue and Forecast, by Product (2021-2033)
12.3.6.2. Market Revenue and Forecast, by Technology (2021-2033)
12.3.6.3. Market Revenue and Forecast, by Procedure (2021-2033)
12.3.6.4. Market Revenue and Forecast, by Application (2021-2033)
12.3.7. Japan
12.3.7.1. Market Revenue and Forecast, by Product (2021-2033)
12.3.7.2. Market Revenue and Forecast, by Technology (2021-2033)
12.3.7.3. Market Revenue and Forecast, by Procedure (2021-2033)
12.3.7.4. Market Revenue and Forecast, by Application (2021-2033)
12.3.8. Rest of APAC
12.3.8.1. Market Revenue and Forecast, by Product (2021-2033)
12.3.8.2. Market Revenue and Forecast, by Technology (2021-2033)
12.3.8.3. Market Revenue and Forecast, by Procedure (2021-2033)
12.3.8.4. Market Revenue and Forecast, by Application (2021-2033)
12.4. MEA
12.4.1. Market Revenue and Forecast, by Product (2021-2033)
12.4.2. Market Revenue and Forecast, by Technology (2021-2033)
12.4.3. Market Revenue and Forecast, by Procedure (2021-2033)
12.4.4. Market Revenue and Forecast, by Application (2021-2033)
12.4.5. GCC
12.4.5.1. Market Revenue and Forecast, by Product (2021-2033)
12.4.5.2. Market Revenue and Forecast, by Technology (2021-2033)
12.4.5.3. Market Revenue and Forecast, by Procedure (2021-2033)
12.4.5.4. Market Revenue and Forecast, by Application (2021-2033)
12.4.6. North Africa
12.4.6.1. Market Revenue and Forecast, by Product (2021-2033)
12.4.6.2. Market Revenue and Forecast, by Technology (2021-2033)
12.4.6.3. Market Revenue and Forecast, by Procedure (2021-2033)
12.4.6.4. Market Revenue and Forecast, by Application (2021-2033)
12.4.7. South Africa
12.4.7.1. Market Revenue and Forecast, by Product (2021-2033)
12.4.7.2. Market Revenue and Forecast, by Technology (2021-2033)
12.4.7.3. Market Revenue and Forecast, by Procedure (2021-2033)
12.4.7.4. Market Revenue and Forecast, by Application (2021-2033)
12.4.8. Rest of MEA
12.4.8.1. Market Revenue and Forecast, by Product (2021-2033)
12.4.8.2. Market Revenue and Forecast, by Technology (2021-2033)
12.4.8.3. Market Revenue and Forecast, by Procedure (2021-2033)
12.4.8.4. Market Revenue and Forecast, by Application (2021-2033)
12.5. Latin America
12.5.1. Market Revenue and Forecast, by Product (2021-2033)
12.5.2. Market Revenue and Forecast, by Technology (2021-2033)
12.5.3. Market Revenue and Forecast, by Procedure (2021-2033)
12.5.4. Market Revenue and Forecast, by Application (2021-2033)
12.5.5. Brazil
12.5.5.1. Market Revenue and Forecast, by Product (2021-2033)
12.5.5.2. Market Revenue and Forecast, by Technology (2021-2033)
12.5.5.3. Market Revenue and Forecast, by Procedure (2021-2033)
12.5.5.4. Market Revenue and Forecast, by Application (2021-2033)
12.5.6. Rest of LATAM
12.5.6.1. Market Revenue and Forecast, by Product (2021-2033)
12.5.6.2. Market Revenue and Forecast, by Technology (2021-2033)
12.5.6.3. Market Revenue and Forecast, by Procedure (2021-2033)
12.5.6.4. Market Revenue and Forecast, by Application (2021-2033)
Chapter 13. Company Profiles
13.1. Medtronic plc
13.1.1. Company Overview
13.1.2. Product Offerings
13.1.3. Financial Performance
13.1.4. Recent Initiatives
13.2. Boston Scientific Corporation
13.2.1. Company Overview
13.2.2. Product Offerings
13.2.3. Financial Performance
13.2.4. Recent Initiatives
13.3. ANGIODYNAMICS
13.3.1. Company Overview
13.3.2. Product Offerings
13.3.3. Financial Performance
13.3.4. Recent Initiatives
13.4. Abbott
13.4.1. Company Overview
13.4.2. Product Offerings
13.4.3. Financial Performance
13.4.4. Recent Initiatives
13.5. Microport Scientific Corporation
13.5.1. Company Overview
13.5.2. Product Offerings
13.5.3. Financial Performance
13.5.4. Recent Initiatives
13.6. B. BRAUN MELSUNGEN AG
13.6.1. Company Overview
13.6.2. Product Offerings
13.6.3. Financial Performance
13.6.4. Recent Initiatives
13.7. KONINKLIJKE PHILIPS N.V.
13.7.1. Company Overview
13.7.2. Product Offerings
13.7.3. Financial Performance
13.7.4. Recent Initiatives
13.8. GE Healthcare
13.8.1. Company Overview
13.8.2. Product Offerings
13.8.3. Financial Performance
13.8.4. Recent Initiatives
13.9. Cardinal Health
13.9.1. Company Overview
13.9.2. Product Offerings
13.9.3. Financial Performance
13.9.4. Recent Initiatives
13.10. Siemens Healthcare GmbH
13.10.1. Company Overview
13.10.2. Product Offerings
13.10.3. Financial Performance
13.10.4. Recent Initiatives
Chapter 14. Research Methodology
14.1. Primary Research
14.2. Secondary Research
14.3. Assumptions
Chapter 15. Appendix
15.1. About Us
15.2. Glossary of Terms
 Cross-segment Market Size and Analysis for
Mentioned Segments
 Additional Company Profiles (Upto 5 With No Cost)
 Additional Countries (Apart From Mentioned Countries)
 Country/Region-specific Report
 Go To Market Strategy
 Region Specific Market Dynamics
 Region Level Market Share
 Import Export Analysis
 Production Analysis
 Others